
A few days back, a reader sent me an email entitled “Great Recession Revisited”. The note included the following tweet, and asked if I felt the same way:
In case you’re wondering, now is finally starting to feel like the hopelessness we felt in 2008-2009. Unrelenting selling. Down 1-3% on a daily basis. No bottom in sight. No confidence in the Fed or the government. Embrace the fear and learn from it.
— Financial Samurai (@financialsamura) December 20, 2018
I certainly understand the sentiment. No confidence in the Fed or government? Check.
Unrelenting selling? No bottom is sight? Definitely feels that way, especially this December.
Down 1-3% on a daily basis? True, but we’ve been in an abnormally low volatility market recently, so I think that feels worse than it really is…FWIW, 2008-2009 was more like 3-5% on a daily basis.
Hopelessness on par with 2008-2009? Uh…no. Not even close. Back then, the recession was in full swing; layoffs were everywhere, nightly news focused on the collapse of financial institutions, and small companies were having problems making payroll because of illiquid credit markets!
Is there apprehension? You better believe it. Economic fundamentals are beginning to decline and we have a few warning signs for a recession in the next 9-24 months.
Check out last week’s review of economic indicators in “On My Radar” from Steve Blumenthal:
- High risk of global recession? Check!
- Unemployment? Actually, labor markets are still improving.
- Yield curve? Flattening, but not inverted yet.
- Credit conditions? Favorable.
- Corporate Debt? A lot…not good!
- Valuations? Even higher than 2007, before the Great Recession…also not good!
So while some aspects are a bit off, I agree with embracing the fear and uncertainty and learning from it. Looking through Steve’s charts, 2006 and 2007 painted a similar picture to the above. Outside of those economic indicators, I see a lot of similarity between 2018 and 2007 as well. Check out the VIX…
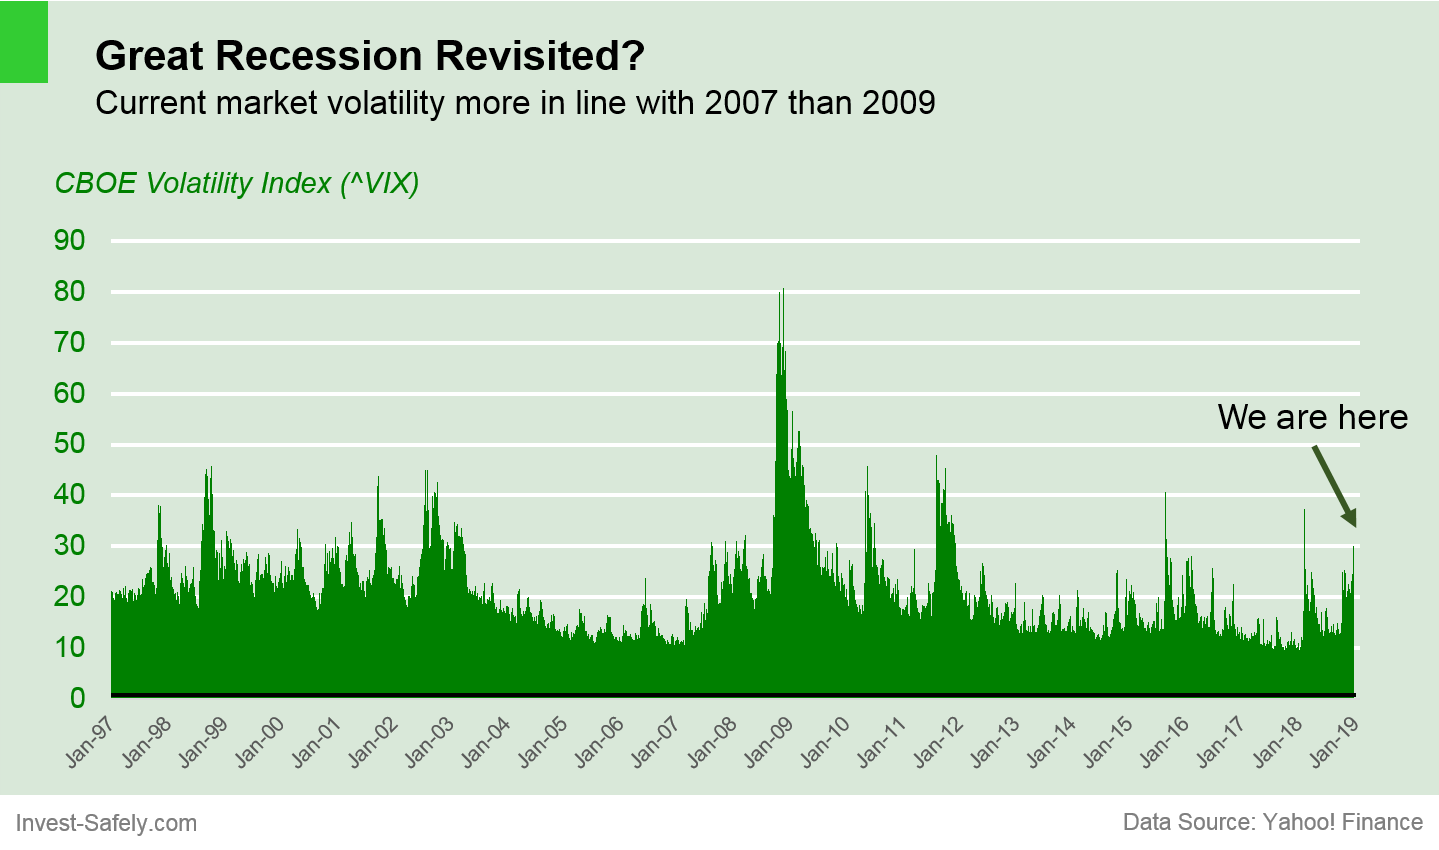
We’re just beginning to experience the volatility coming off record lows…just like 2006 and 2007.
Price action is also similar to late 2007…eerily similar for the S&P500. The timeframe is off by a week or two, but overall results are similar. A 16% decline by the start of the new year (1).

2008-01-18 – SPX Technical Analysis – Weekly
Bear Sterns went under that March and the S&P hit a new low, before indexes rallied back to a trendline (2). By mid-2008, stocks were just one of MANY types of investments getting hammered, and that was before volatility really took off (3,4).

2008-12-18 – SPX Technical Analysis – Weekly
The saying goes “History doesn’t repeat, but it often rhymes”. If we’re going to see another 2008-2009 style, recessionary sell-off, I’d expect economic indicators to be weaker beforehand. There’s no shortage of reasons that could happen, so pick your poison. In the meantime, that would give stocks a chance to rebound, creating the classic bull trap (2).

Or, maybe the “bull trap” occurred in 2018 Q3…maybe we have one, last rip your face off rally! No one really knows. As has been said many times on this blog, “You can’t predict, you can only prepare.”
Great Recession revisited? Not quite…or at least not yet. Instead, the markets have given investors a wake up call. So the question isn’t whether we’re going to see another recession…the question is “What are you doing to prepare?”


