Stock Market Outlook entering the Week of May 3rd = Uptrend
-
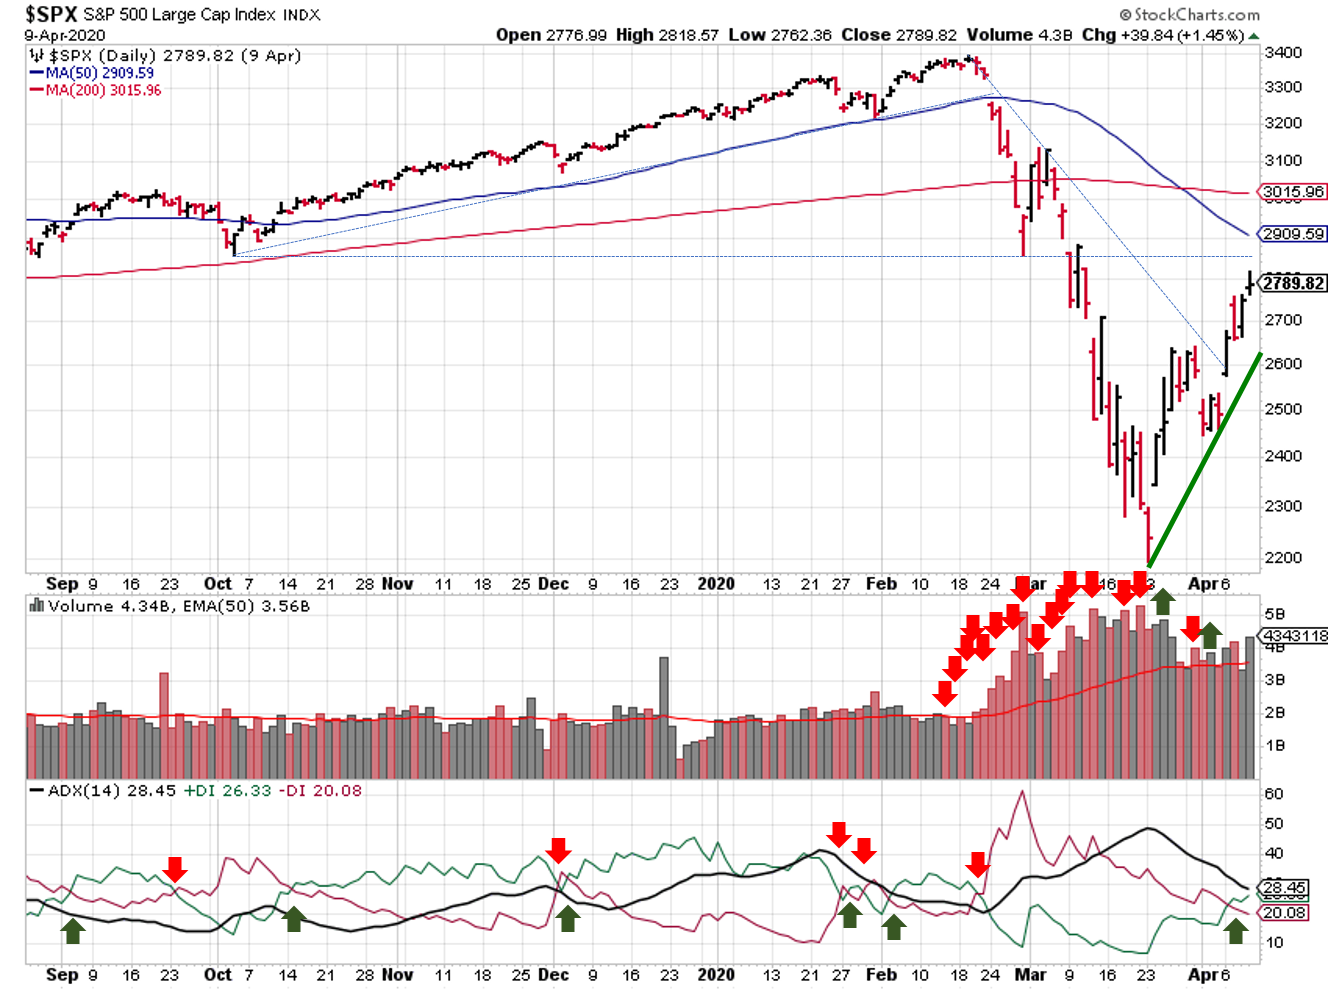
- ADX Directional Indicators: Uptrend
- Price & Volume Action: Uptrend
- Elliott Wave Analysis: Downtrend
COMMENTARY
The stock market outlook starts May in an uptrend. The ADX and price/volume signals are bullish, while Elliott Wave indicates a downtrend.

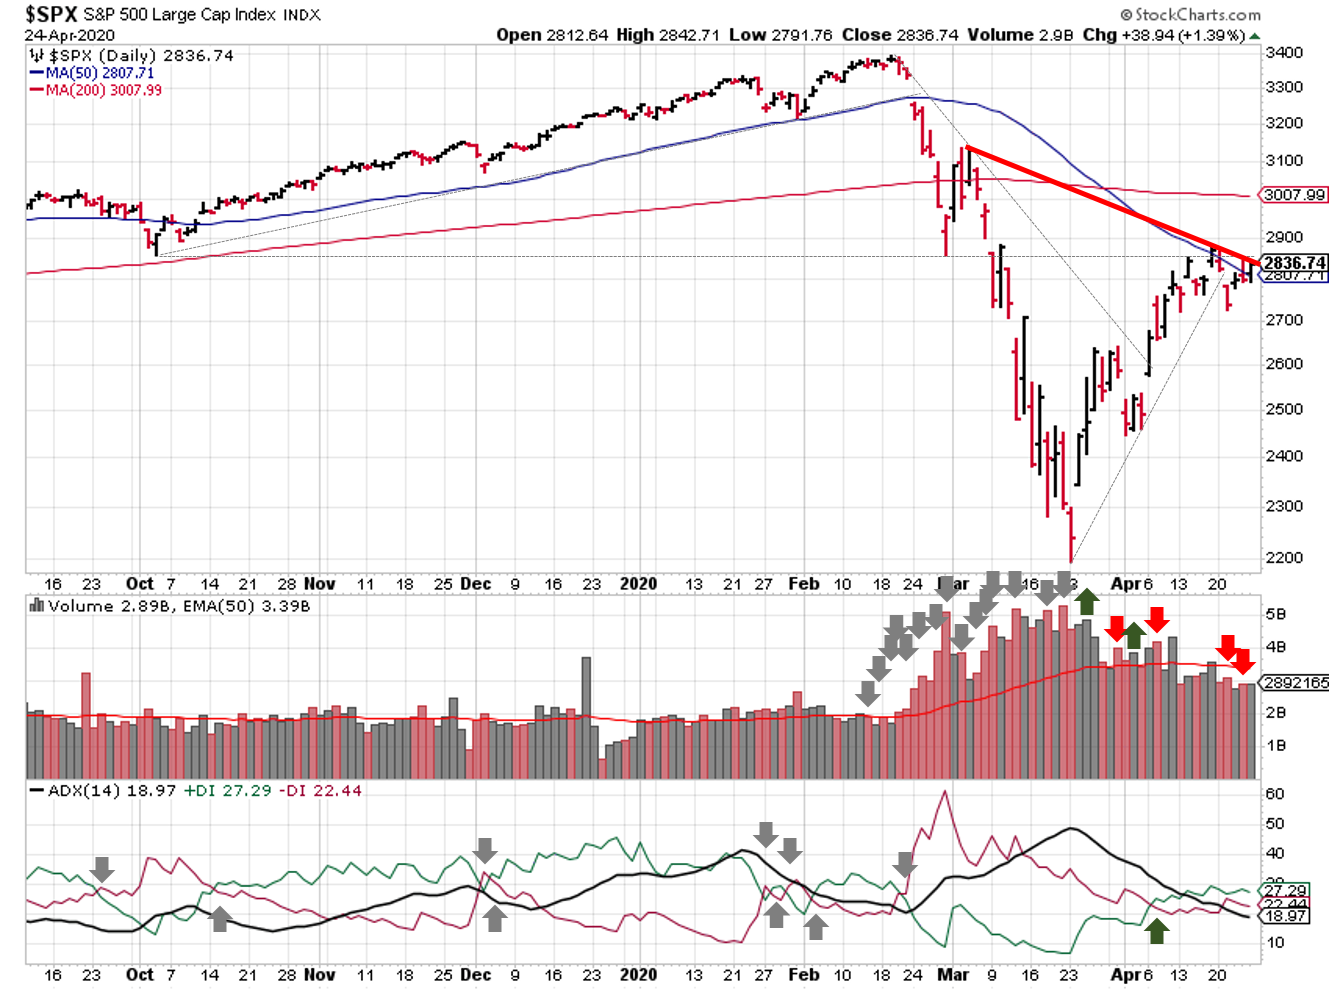
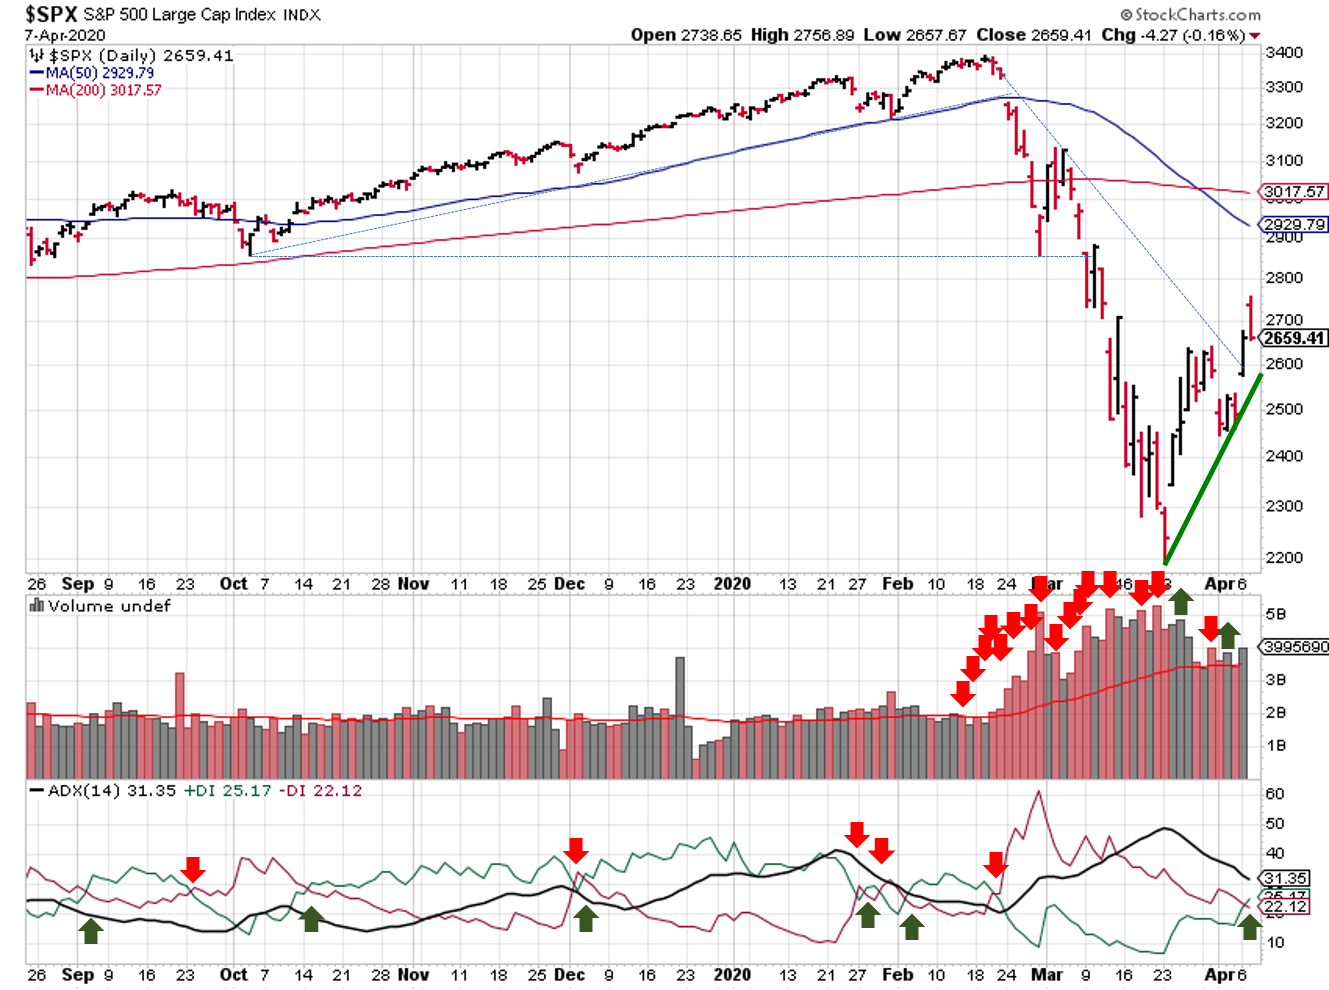
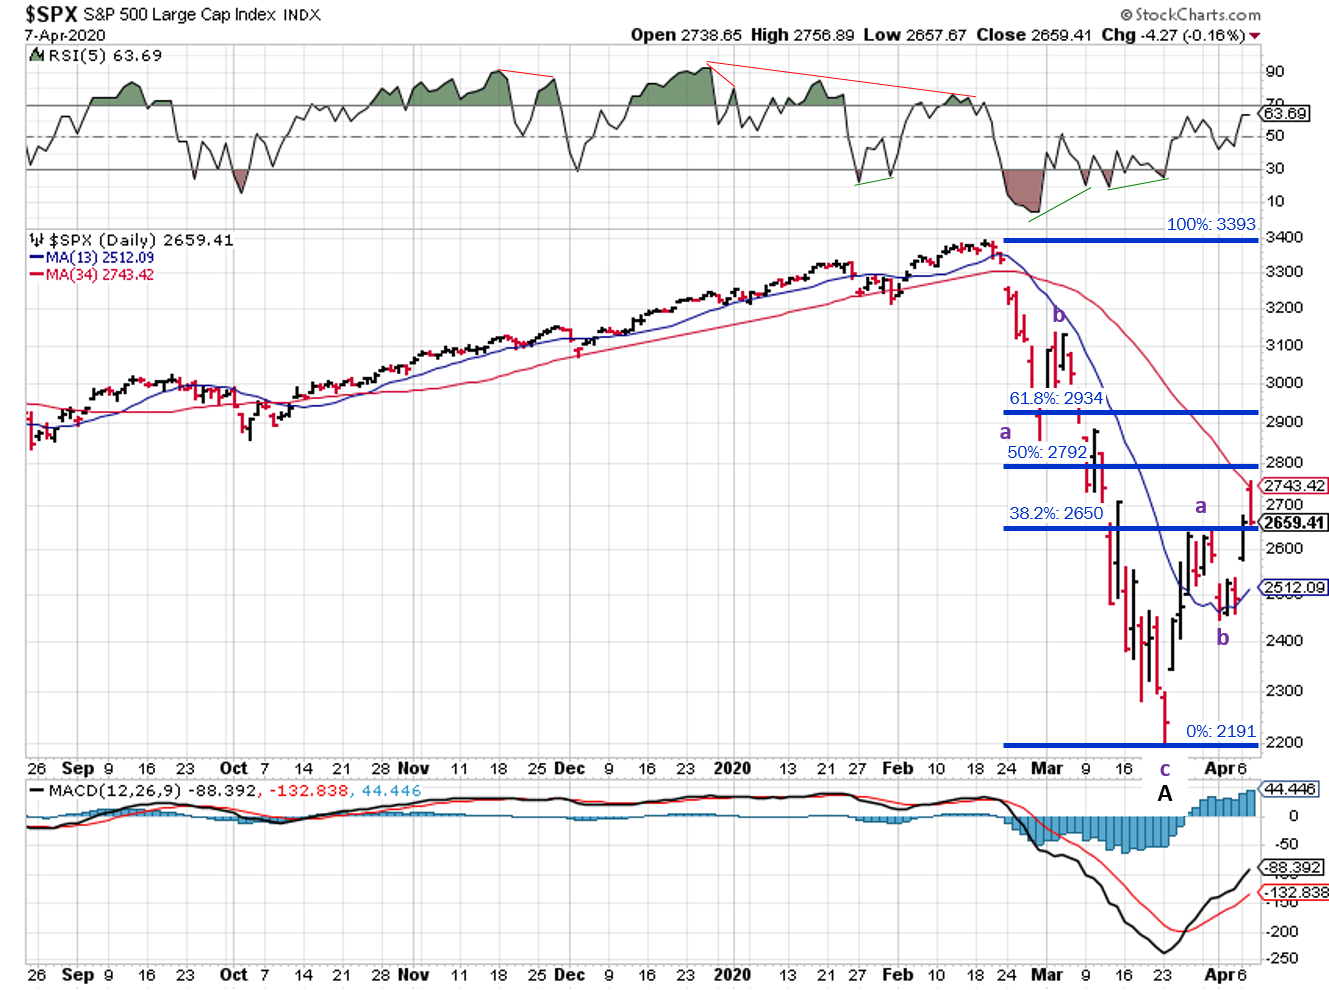
2020-05-03 – SPX Trendline Analysis – Daily
The S&P500 ($SPX) looked ready to take on the 200-day moving average last week, but ran out of gas Friday. Another day like that and we’ll see the ADX crossover and be back in a confirmed downtrend thanks to the Elliott Wave signal. The good needs is that the overall ADX is still below 25, so any pullback should be really weak and/or short-lived. Not a lot of institutional selling either.
The downward trendline I laid in last week was broken on Monday. After the weak price action Thursday and Friday, I think the resistance is still there, so I pivoted it to Wednesday’s high.
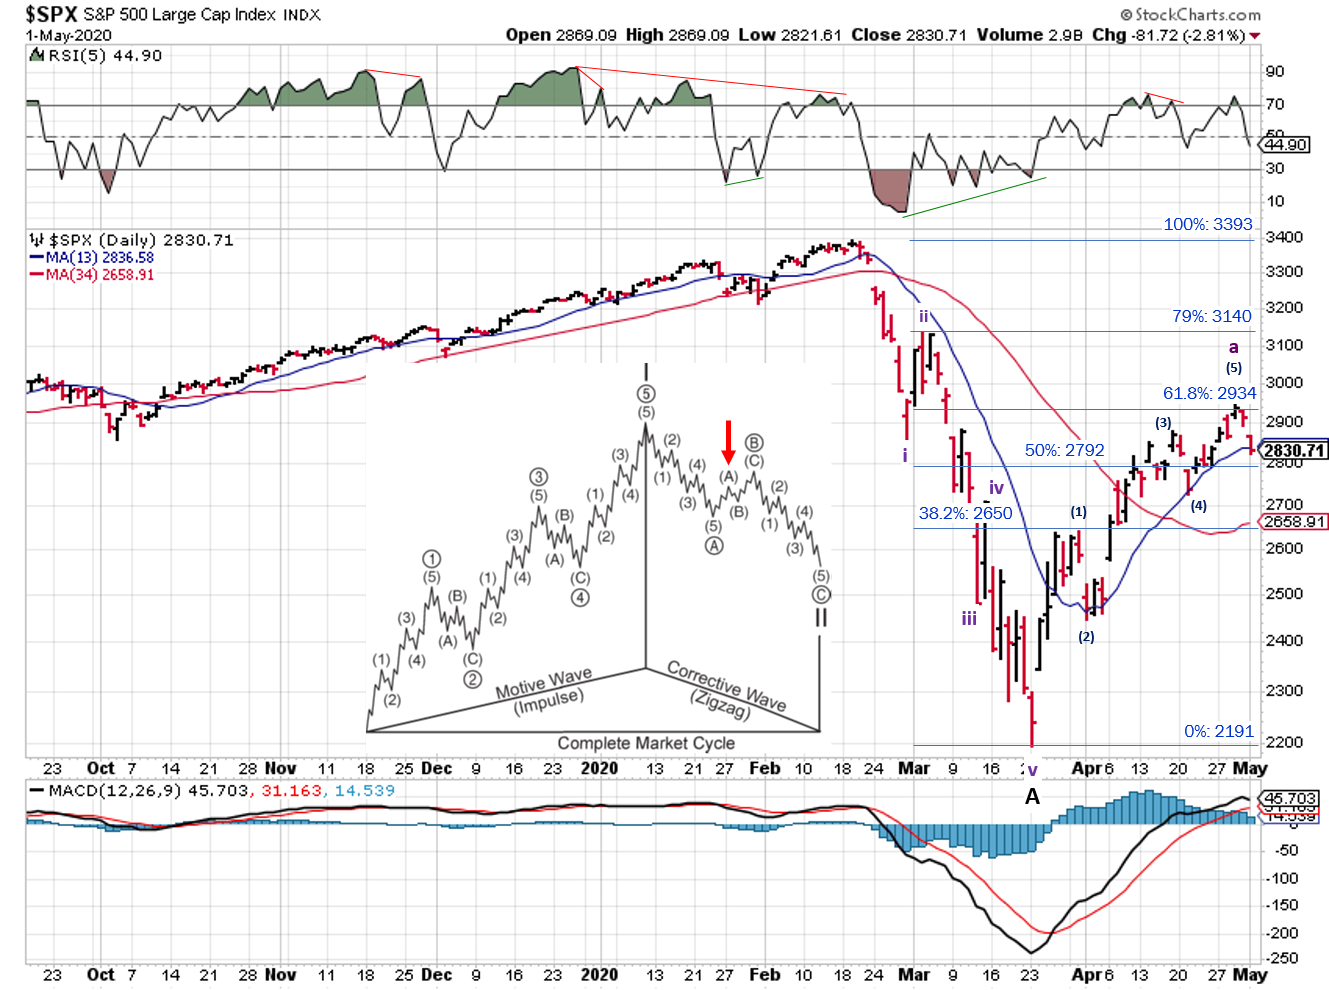
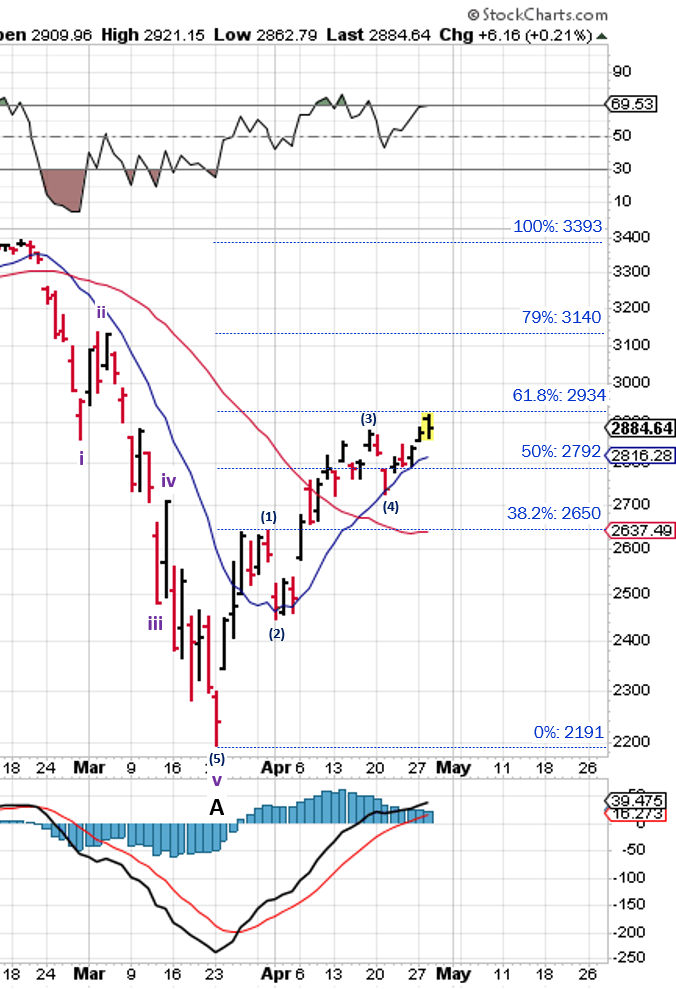
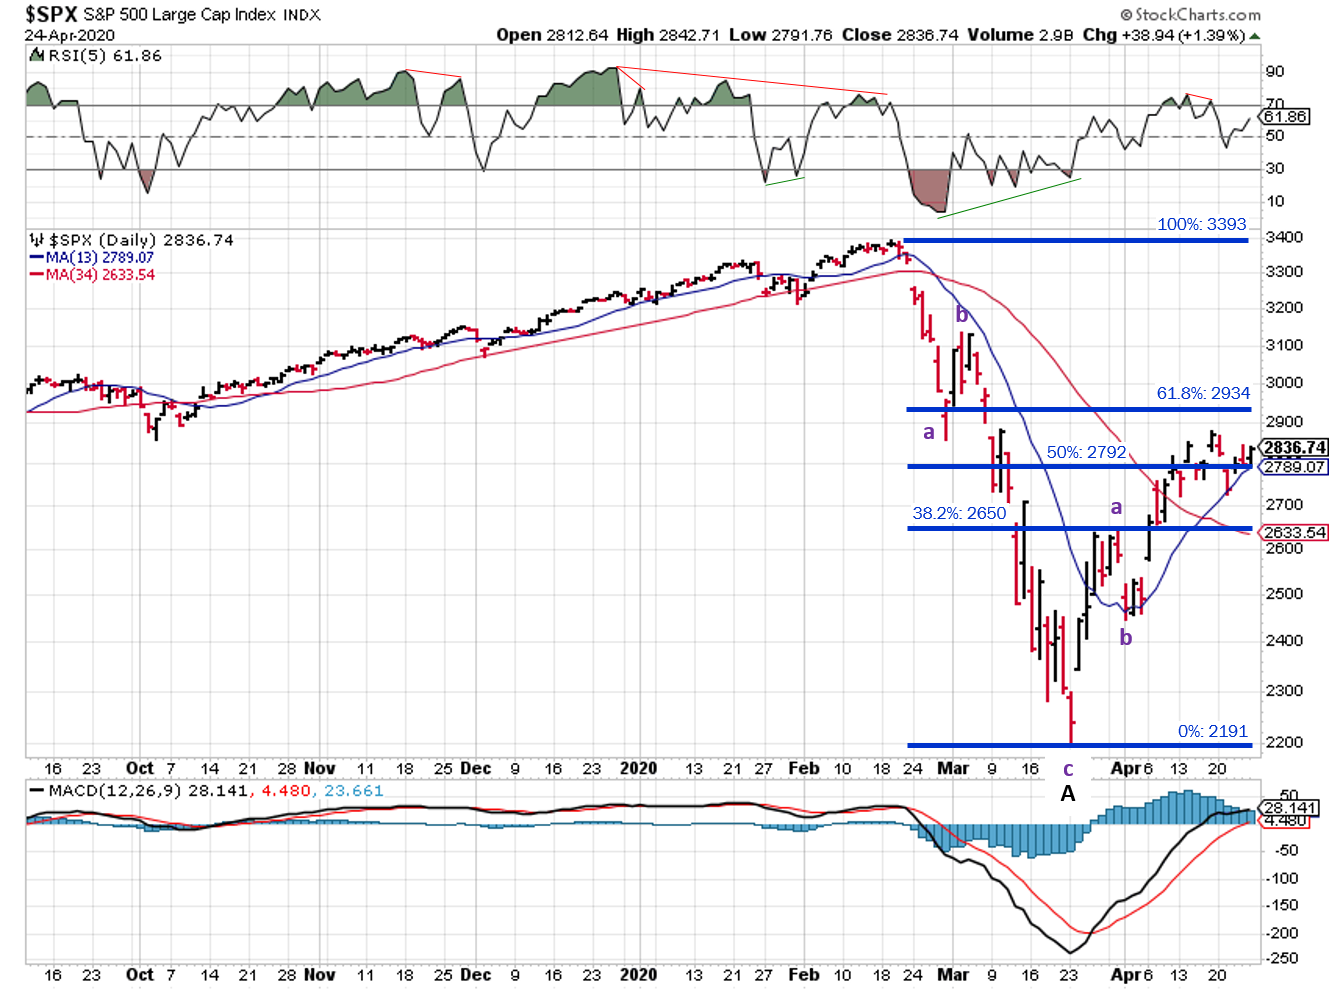
2020-05-03 – SPX Elliott Wave Analysis – Daily
For Elliott wave, the S&P500 pulled away from the 50% retracement level (~2792), only to run into resistance at the 61.8% level.
I made a few mistakes in my wave counts, which resulted in the wrong price targets and an incorrect signal. Fortunately, the other two signals were correct and majority rules. But it happens with Elliott Wave, particularly when new trends are getting started.
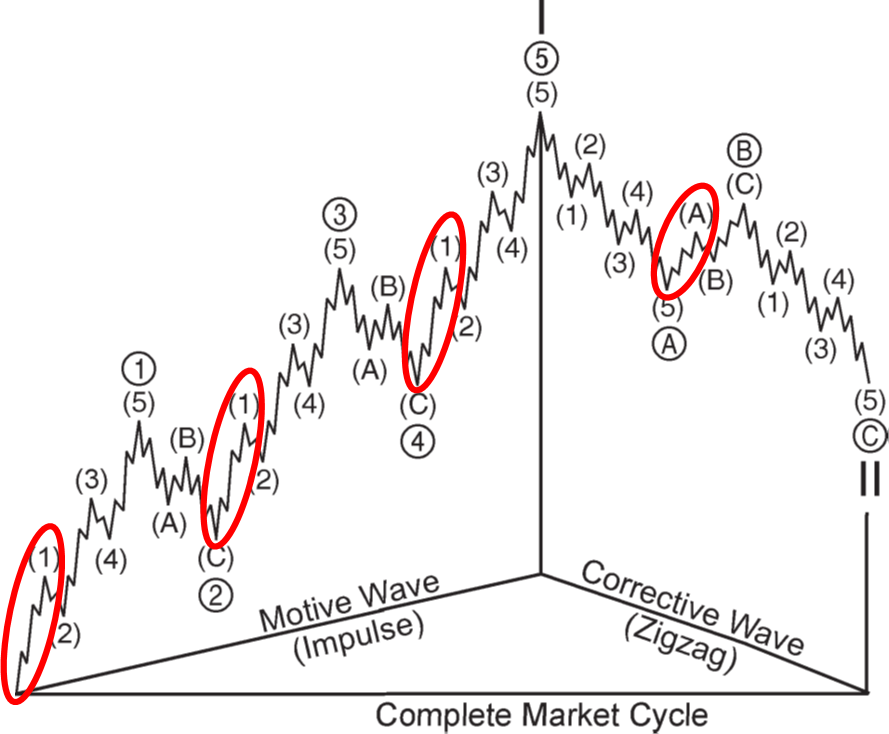
After some additional analysis, we just finished the a-subwave of the B-wave, and are now starting the b-subwave. Since the a-wave was 5 waves, we can expect the b-wave to be 3 waves. Typically, the b-wave of a zigzag retraces 50-79% of the a-Wave The a-wave started at 2191 and ended at 2955, for a total move of 764.
- 50% * 764 = 382
- 2955 – 382 = 2573
- 61.8%* 764 = 472
- 2955 – 472 = 2483
- 79% * 764 = 604
- 2955 – 604 = 2351
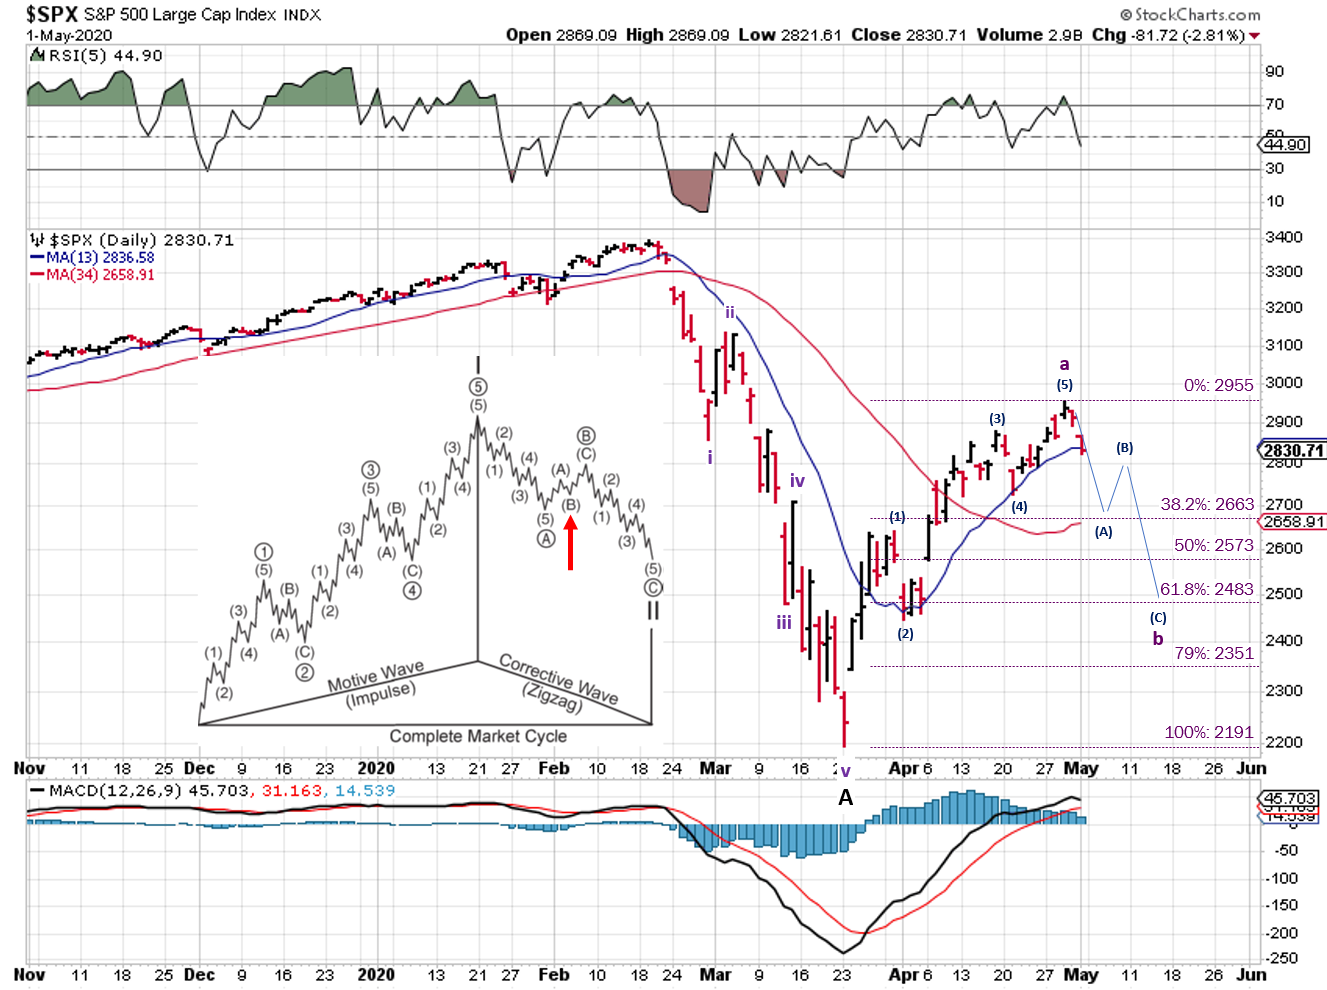
2020-05-03 – SPX Elliott Wave Analysis – Daily – b-wave
So the targets for completion of the b-wave are between 2573 and 2351. If the b-wave pattern is a flat or a triangle (not drawn), I’d expect the downtrend to be shallower; may not even get to the 50% level.
Reopening the economy was on everyone’s mind last week; will they, won’t they, and if so, how much. In the mean time, the stock market continues higher, with the S&P500 having it’s best month since 1987. Billions of dollars of stimulus doesn’t hurt…for now. When that bill comes due, it may be a different story.
The Fed didn’t change rates last week, and committed to keep them near zero until employment recovers and we see some inflation.
More companies stopped providing full year guidance. More companies cut their dividends; Royal Dutch Shell for the first time since World War II! Something for income investors to consider if they’re salivating over yields in the oil and gas industry.
As discussed companies with strong balance sheets and high demand for their products in a “stay at home” economy are doing well, relatively speaking of course.
Some balance sheet metrics to look for include:
- Debt to Equity Ratio < 1.0 – New assets can be purchased with equity (vs. debt)
- Cash to Debt Ratio > 1.5 – Cash from operations can cover debts
- Quick Ratio > 1.0 – Assets (w/o inventory) are larger than debts
- Current Ratio > 1.0 – Current assets are larger than current liabilities
Best to your week!