Stock Market Outlook entering the Week of December 6th = Uptrend
-
- ADX Directional Indicators: Uptrend
- Price & Volume Action: Uptrend
- Elliott Wave Analysis: Uptrend
ANALYSIS
The stock market outlook kicks off the last month of 2020 in an uptrend.

2020-12-06-SPX Trendline Analysis-Daily
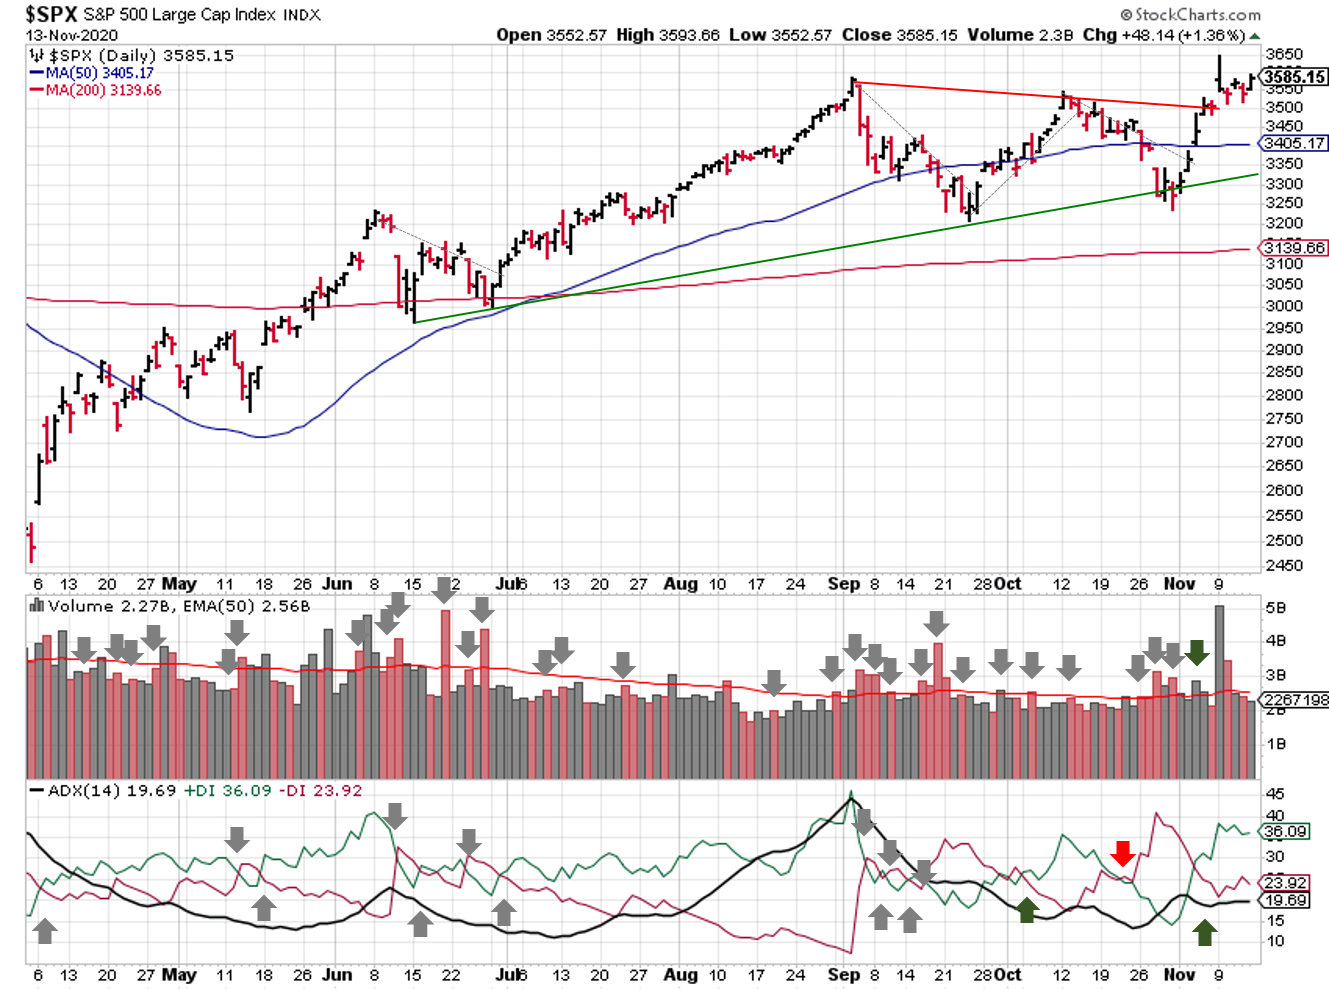
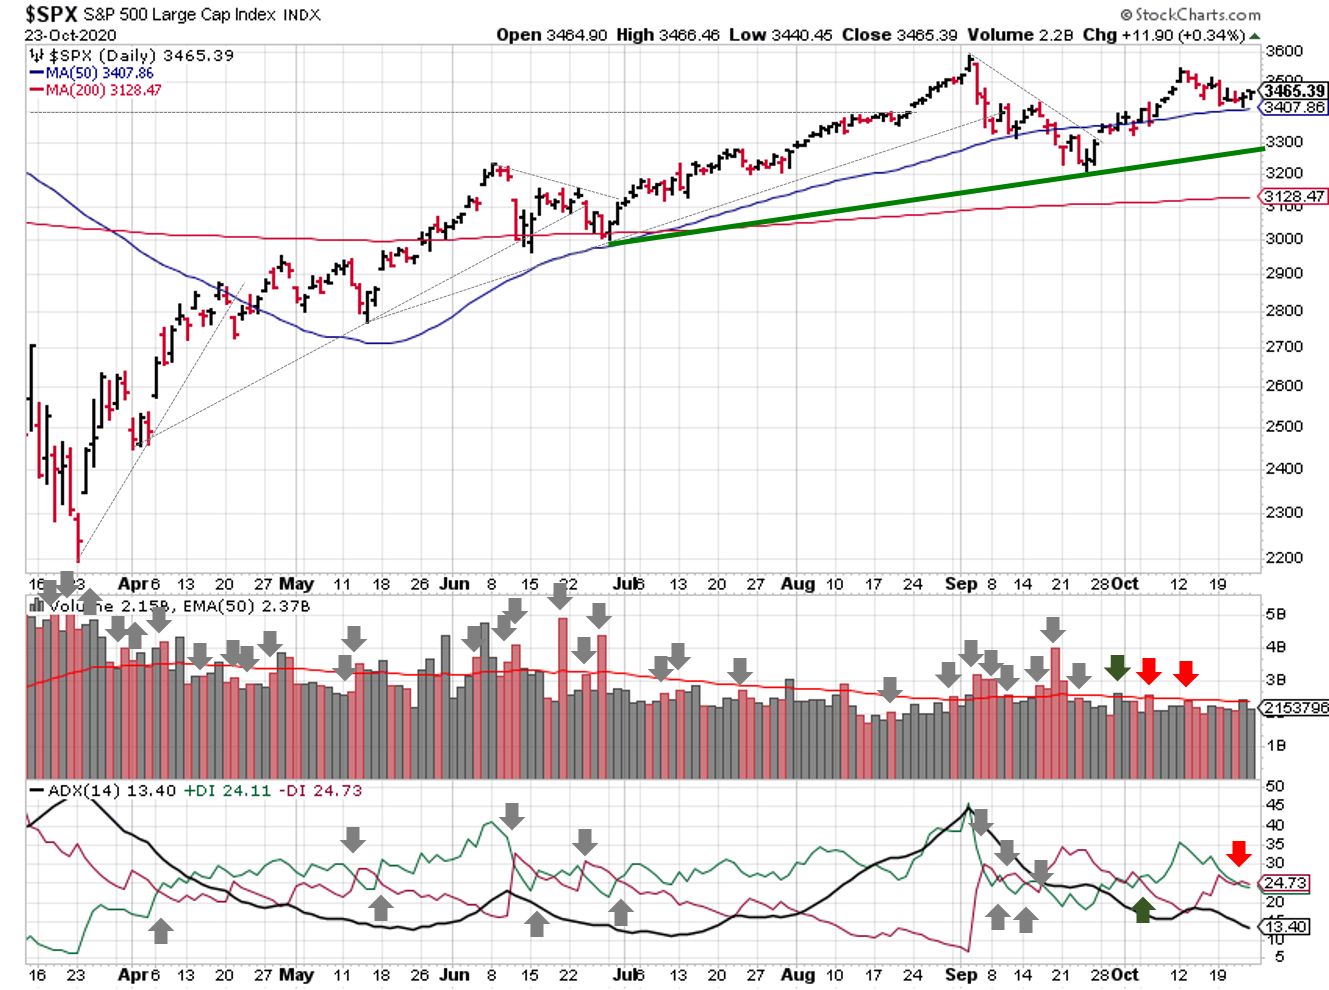
The S&P500 ($SPX) starts the week at all time highs. The ADX and price/volume both remain in uptrends, though the trend isn’t very strong (ADX) and we’ve picked up some distribution days (price/volume).
The index is also ~14.5% above the 200-day moving average; remaining in extended territory verses historical performance.

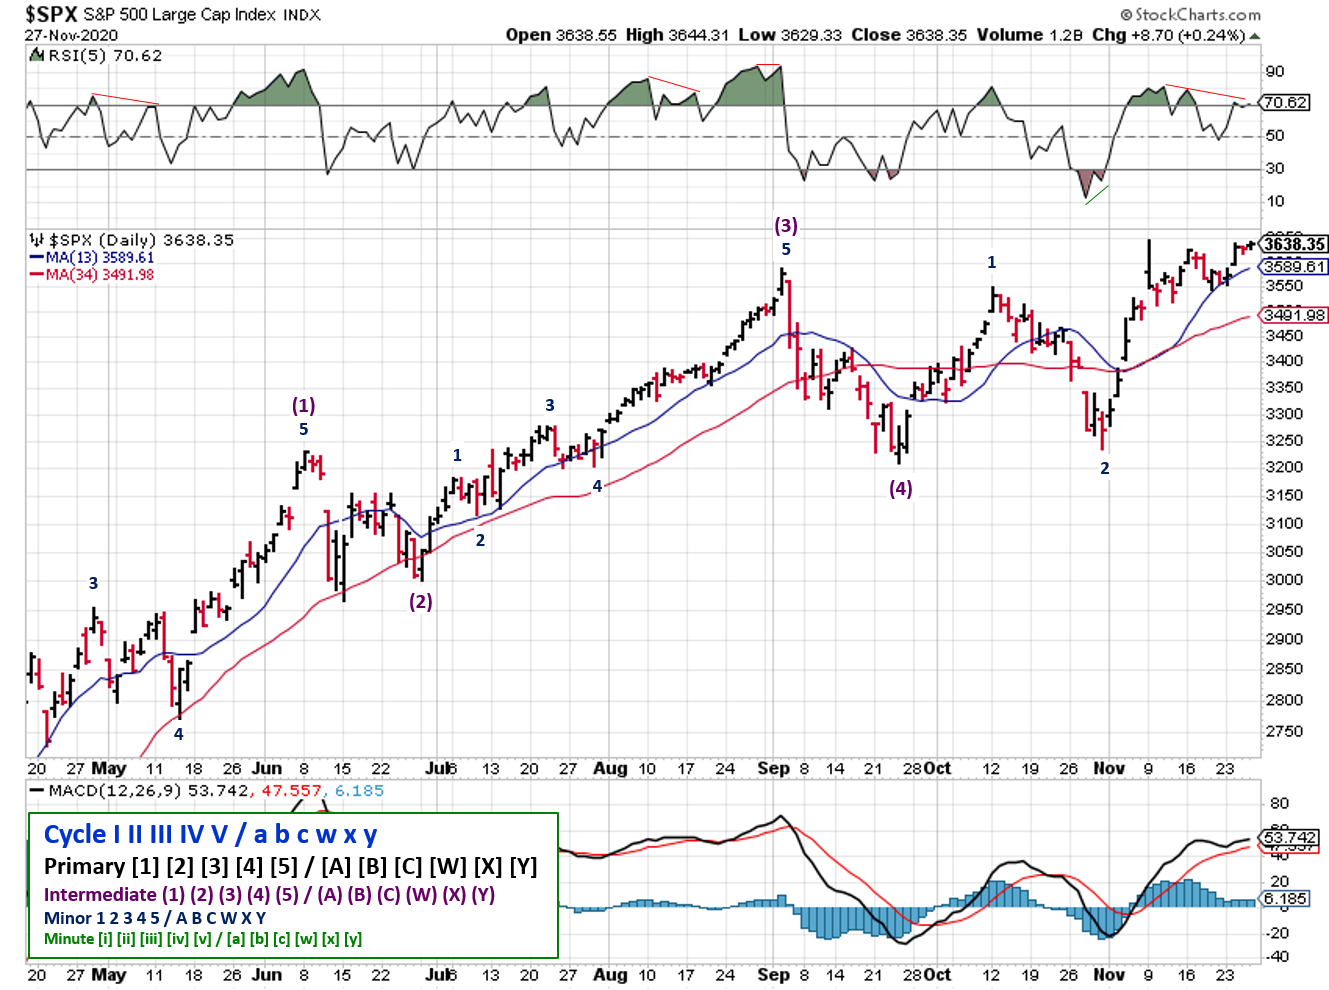
2020-12-06-SPX Elliott Wave Analysis-Daily-Primary1
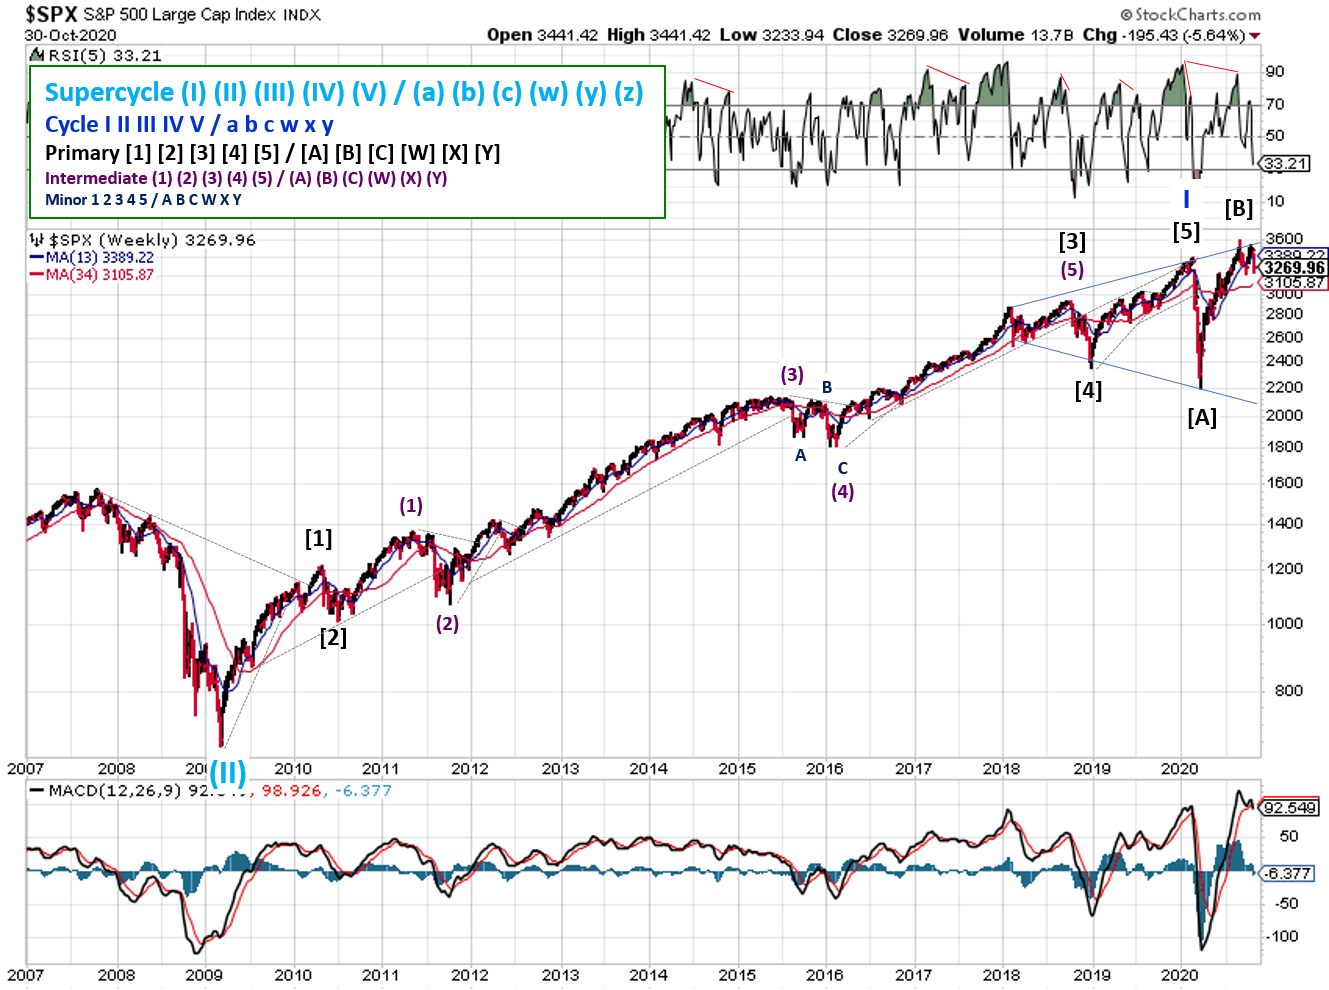
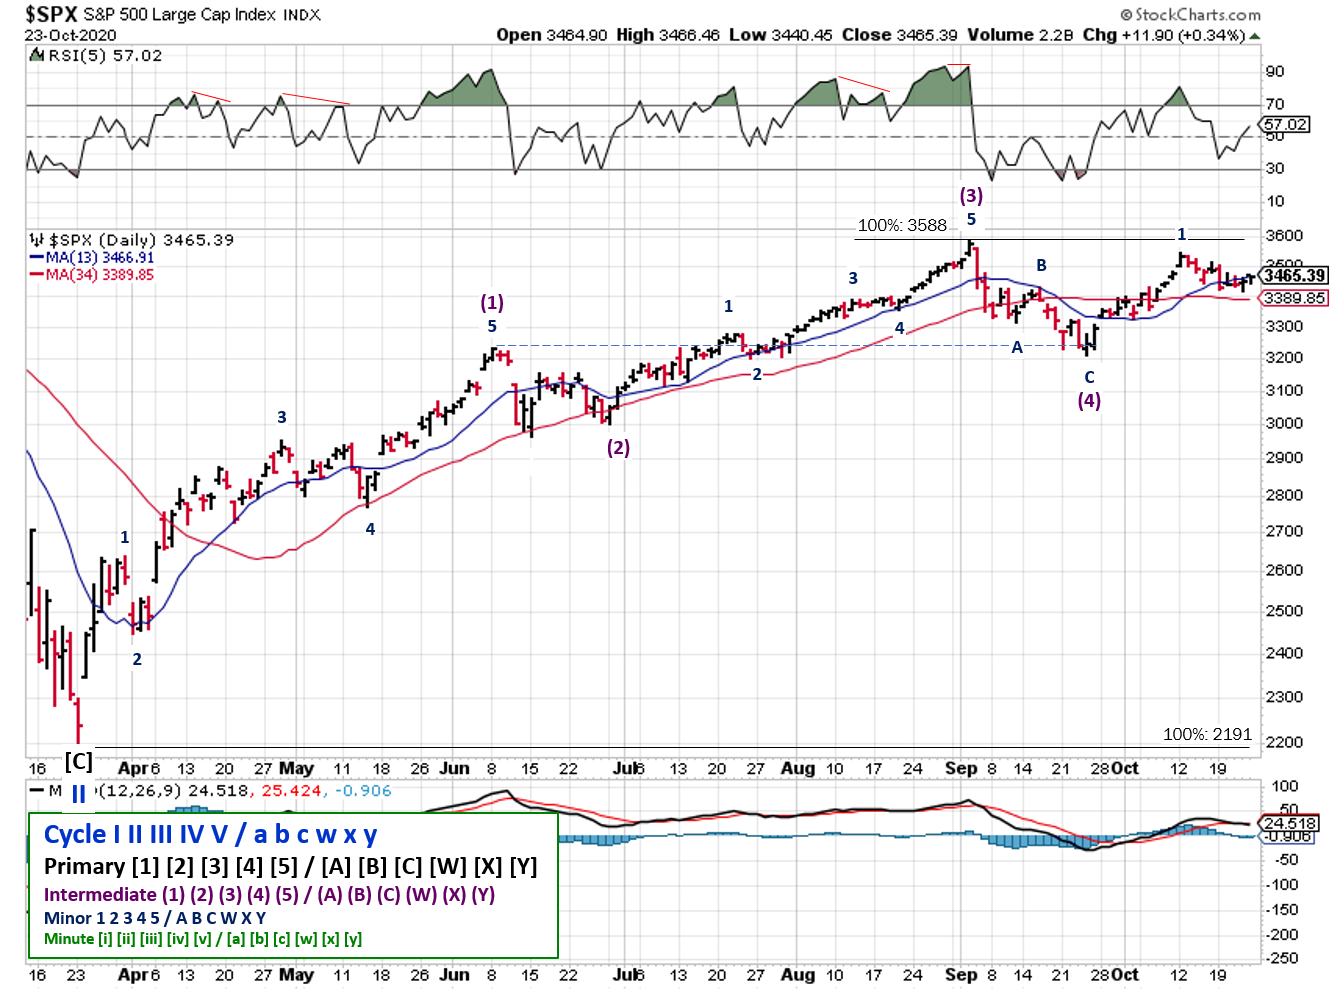
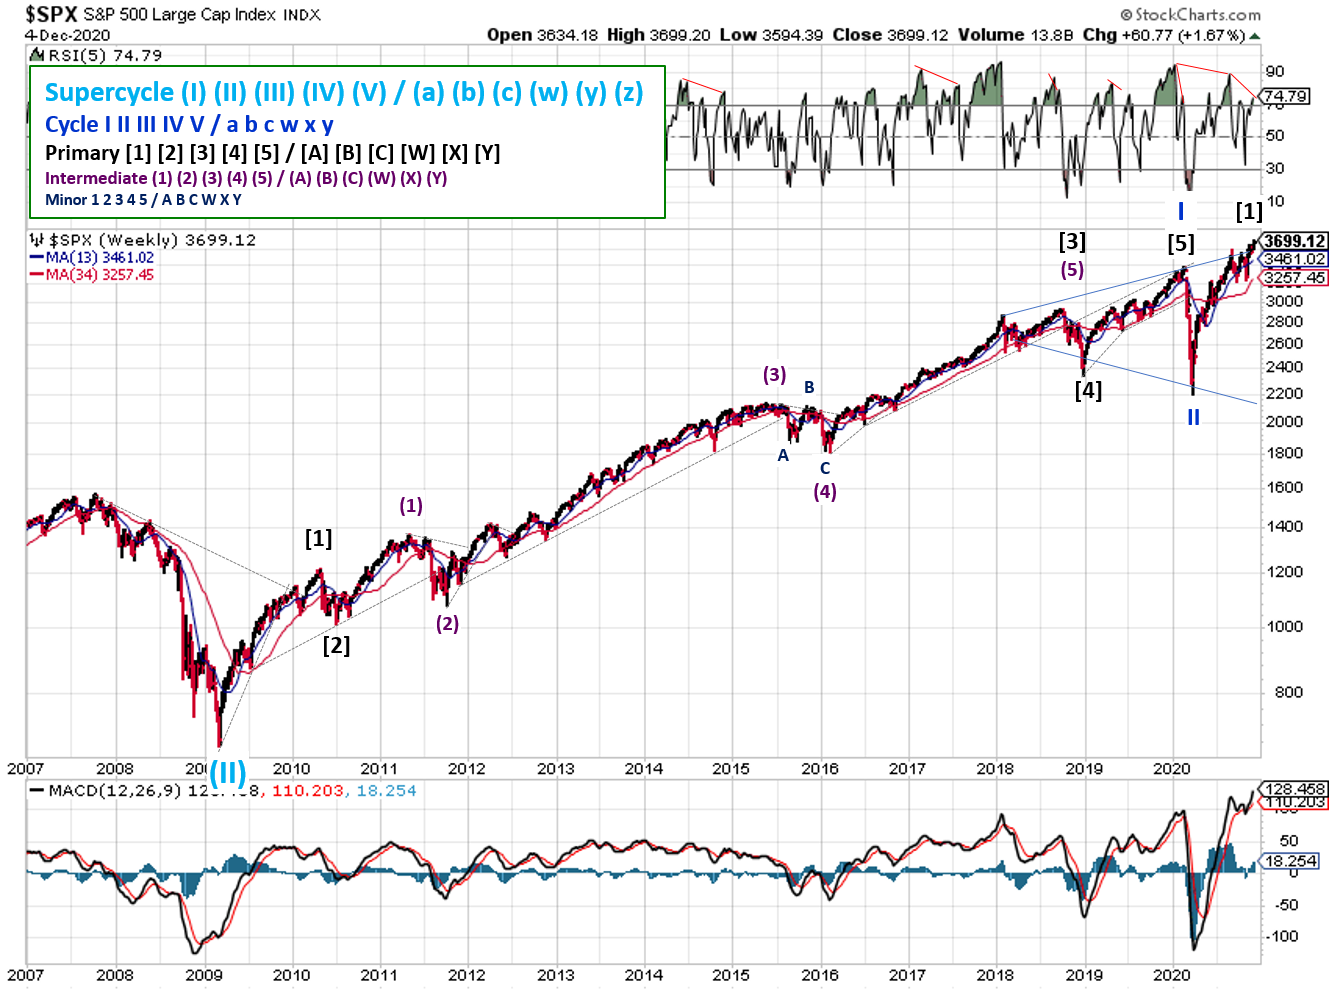
Elliott Wave remains in an uptrend. The negative divergence mentioned last week was short lived. And the updated monthly view now reflects the Primary 1 count. Interesting to note there are substantial negative divergences in both the RSI and the MACD histogram right now.
2020-12-06-SPX Trendline Analysis-Weekly
The monthly view is updated to reflect the change to a Primary 1. Interesting to note there are substantial negative divergences in both the RSI and the MACD histogram right now, and prices extended above the megaphone pattern mentioned last month.
COMMENTARY
November was a great month for the stock markets, with the S&P gaining 13%. Good news related to the pandemic didn’t hurt (coronavirus vaccines allow investors to focus on “when” no “if” the economy reopens).
That’s not to say things are all good just yet. The latest unemployment report underwhelmed, thanks to a surge in cases during the month. We still don’t have additional fiscal stimulus, but any further weakness will likely force lawmakers to compromise.
December is usually a good month for stocks…I’m sure everyone is looking forward to a Santa Claus rally!
Best to Your Week!
P.S. Great articles on the economy from Steve and John this week on debt, interest rates, and the challenges we face going forward; definitely worth your time.
What do we do now? – https://www.cmgwealth.com/ri/on-my-radar-what-do-we-do-now/
Elites on the Edge – https://www.mauldineconomics.com/frontlinethoughts/elites-on-the-edge