Weekend Stock Market Outlook – June 18 2023

Stock Market Outlook entering the Week of June 18th = Uptrend

  • ADX Directional Indicators: Uptrend
  • Price & Volume Signals: Uptrend
  • Elliott Wave Analysis: Mixed

ANALYSIS
The stock market outlook starts the week in an uptrend, on the back of lower than expected inflation, no Fed rate hike, and the largest option expiration on record.

The S&P500 ($SPX) rallied 2.6% last week.  The index is up ~15% since the start of the year, up ~26% from the bear market low (Oct 2022), and down ~9% from the high of the last bull market (Feb 2022).

Technical analysis of daily SPX prices

SPX Price & Volume Chart for the Week of June 18 2023

No change in signal from the ADX, but both directional indicators (DI+/ DI-) sit at extreme levels. The last time the ADX set-up like this was at end of August, 2020. A 10% correction occurred during the next month.

Price/volume also shows an uptrend in place.  Even the Innovator IBD 50 ETF ($FFTY) fund joined the action, rising past prior resistance levels.

Technical analysis of daily SPX prices

SPX Elliott Wave Analysis for the Week of June 18 2023 – Bullish Count

Believe it or not, there’s no change in Elliott Wave counts.  Both the bullish and bearish views allowed for last week’s move within their respective 5th waves.  As mentioned last week, watch for a bearish MACD cross-over in the daily charts to confirm the end of the rally.

COMMENTARY
An impressive rally in U.S. stocks last week, with economic data showing the effect of higher interest rates.

The headline number for May consumer inflation data (CPI) came in at +4.0% Y/Y, which is down 0.9%. Core CPI also declined +5.3% Y/Y, which is a deceleration of 0.2%. The Producer Price Index (PPI) declined 0.3 percent in May, showing +1.1% Y/Y.

In response to slowing inflation, the U.S. FOMC announced a pause or “skip” in interest rate increases.

Retail sales were slightly better than expected, rising 1.6% Y/Y, showing that the consumer is still willing to spend.  However, initial jobless claims appear to be bottoming, highlighting that producers remain cautious when it comes to labor costs.

And after a week of “dovish” data, market participants used Friday’s quadruple witching day to book some gains.

Best to Your Week!

P.S. If you find this research helpful, please tell a friend.
If you don’t, tell an enemy.

Sources: Bloomberg, CNBC, Federal Reserve Bank of St. Louis, Hedgeye, T1 Alpha, U.S. Bureau of Economic Analysis, U.S. Bureau of Labor Statistics

Invest Safely, LLC is an independent investment research and online financial media company.  Use of Invest Safely, LLC and any other products available through invest-safely.com is subject to our Terms of Service and Privacy Policy.
Not a recommendation to buy or sell any security.
Posted in Historical Data, Market Trends | Tagged , , , , | Comments Off on Weekend Stock Market Outlook – June 18 2023

Weekend Stock Market Outlook – June 11 2023

Stock Market Outlook entering the Week of June 11th = Uptrend

      • ADX Directional Indicators: Uptrend
      • Price & Volume Signals: Uptrend
      • Elliott Wave Analysis: Mixed

ANALYSIS
The stock market outlook maintained an uptrend, as the S&P500 ($SPX) added 0.4% last week and financial media began hyping the “new bull market” with prices up 20% from the October 2022 low.

Technical analysis of daily SPX prices

SPX Price & Volume Chart for the Week of June 11 2023

No change in signal from the ADX or price/volume; both show uptrends as of Friday’s close.

Bullish and bearish Elliott Wave counts continue to play out, leaving the overall signal mixed.  Both views show a completed uptrend from the March low, increasing the probability of a correction over the next month or so.

Technical analysis of daily SPX prices

SPX Elliott Wave Analysis for the Week of June 11 2023

The bullish count has the necessary requirements for a completed Minor 1 wave.  A Wave 2 correction typically retraces 61.8% to 78.6% of the first wave.

Technical analysis of daily SPX prices

SPX Elliott Wave Analysis for the Week of June 11 2023

Reviewing the checklist from last week’s bearish count also shows the SPX met the criteria for completing the current wave (Minute [v] / Minor C):

  • Rally up w/ an overbought RSI(5) reading = Minute [iii] wave – check
  • Fall back toward 4231 = Minute [iv] wave – check
  • Rally / bounce w/ a negative divergence in the RSI(5) = Minute [v] wave – check

Watch for a bearish MACD cross-over in the daily charts to confirm the end of the rally.

COMMENTARY
Heading into this week, the SPX is flirting with a new high for the year.  Meanwhile, the SPX’s volatility index ($VIX), or so-called “fear gauge”, is at a new low.  This means that expectations for a large downside move within the next 30-days are at their lowest point this year.

In fact, fear is so low that financial media is falling all over themselves to call the start of a new bull market.  Historically, cover stories are great contrarian indicators.  Just saying…

https://platform.twitter.com/widgets.js

With that backdrop, there’s a big potential for volatile market action because each day has potential market moving events!

On Monday and Tuesday, the U.S. Treasury conducts the first bond issuance to refill the TGA, to the tune of $296B.  That’s about 1/3 of the total $750B needed within the next 3-4 months.

https://platform.twitter.com/widgets.js

Recall from last week’s note that the 2 key unknowns were the size of the offerings and which institutions were buyers.  Restoring the balance sheet in large chunks creates larger capital flows (i.e. bigger reductions /sales of other assets).  Now we need to watch who’s buying.

Also on Tuesday, the BLS releases May inflation data (CPI), following by PPI on Wednesday.

The latest will they/won’t they rate debate ends on Wednesday afternoon, when the U.S. FOMC announces its latest interest rate decision.

On Thursday, data is released for retail sales, initial jobless claims, and import/export pricing.

And we close out the week with a quadruple witching day on Friday, with option expiration across all durations.

Best to Your Week!

P.S. If you find this research helpful, please tell a friend.
If you don’t, tell an enemy.

Sources: Bloomberg, CNBC, Federal Reserve Bank of St. Louis, Hedgeye, T1 Alpha, U.S. Bureau of Economic Analysis, U.S. Bureau of Labor Statistics

Invest Safely, LLC is an independent investment research and online financial media company.  Use of Invest Safely, LLC and any other products available through invest-safely.com is subject to our Terms of Service and Privacy Policy.
Not a recommendation to buy or sell any security.
Posted in Historical Data, Market Trends | Tagged , , , , | Comments Off on Weekend Stock Market Outlook – June 11 2023

Weekend Stock Market Outlook – June 4 2023

Stock Market Outlook entering the Week of June 4th = Uptrend

      • ADX Directional Indicators: Uptrend
      • Price & Volume Signals: Uptrend
      • Elliott Wave Analysis: Mixed

ANALYSIS
The stock market outlook maintained an uptrend, as the S&P500 ($SPX) added 1.8% last week.  That said, stocks are beginning to show overbought signals.  Stay frosty, and watch your indicators for confirmation of any trend changes.

Technical analysis of daily SPX prices

SPX Price & Volume Chart for the Week of June 4 2023

The ADX is bullish, inline with the end of May rally.  The bullish directional indicator (DI+) nearing 40 is an overbought signal, and usually precedes a reversal or correction.

Price and volume remain continue to signal an uptrend as well.  Index rebalancing contributed to last week’s distribution day, so it’s less impressive than the volume would suggest.3

Elliott Wave counts were in need of an overhaul in response to the push higher last month, but the signal remains mixed.  Thanks to the range bound price action over the past 1.5 years, the overlapping waves made the analysis difficult at best.

One aspect of Elliott Wave that isn’t mixed is the RSI(5) indicator.  Regardless of viewpoint, the RSI(5) is signaling overbought and suggests another pullback or correction is near.

Technical analysis of weekly SPX prices

SPX Elliott Wave Analysis for the Week of June 4 2023 – Bearish Count

Long term, the bearish wave count shows the SPX in the middle of a running or expanded flat pattern, which happens when price moves sideways and volatility declines.  These patterns have B-wave that terminates higher than the start of the A-wave, which was the February 2nd peak at 4195.  The target for Intermediate (B) is 123.6% of Intermediate (A), or 4286.   For reference, a 161.8% retracement would be 4434, and the August 2022 peak was 4325.

Technical analysis of weekly SPX prices

SPX Elliott Wave Analysis for the Week of June 4 2023 – Bullish View

The long-term, bullish count shows a the market in the first Minor wave of Intermediate (3).

The daily views don’t show a negative divergence in the RSI(5) yet, suggesting that the SPX is in the middle or 3rd wave off the recent low (4100) rather than a final or 5th wave. Look for a negative divergence in the RSI to develop in the RSI as confirmation.

Technical analysis of daily SPX prices

SPX Price & Volume Chart for the Week of June 4 2023 – Bearish View

For the bearish count, the Minute [iv] wave drops the SPX back to toward 4231 (Minute [i] peak), and then back towards 4300 to complete Minute [5] / Minor C.  If the rally is truly complete, expect to that peak confirmed by a bearish MACD x-over with a week or so.

Technical analysis of daily SPX prices

SPX Elliott Wave Analysis for the Week of June 4 2023

The price levels are the same for the bullish count, just with Minutte waves rather than Minute.

COMMENTARY
Headline employment data continues to show a relatively healthy labor market.  JOLTS and NFP numbers were better than expected, although the overall unemployment was slightly higher than expected at 3.7% (+20 basis points or 0.2%).  Keep in mind that employment data is a lagging indicator and typically starts to weaken AFTER the economy is already weakening.  Leading indicators, such as the yield curve, are well into slowdown territory.

A light week for economic data releases, but there could be some issues below the surface of financial markets.  Now that the debt ceiling is done and dusted, the U.S. Treasury should start reversing the extraordinary measures used to bridge the funding gap (i.e. drawing funds from the Treasury General Account).  In other words, the government bonds need to be issued / sold, with those proceeds replenishing the TGA account balance.

Per the Financial Times, “restoring a healthy balance…will require about $750bn of Treasury bill issuance over the next 3 to 4 months”, with the total amount at ~$1 trillion.  Money to buy these bonds will come out of other financial instruments, and the fear is that stocks, as an asset class, will be sold in order to fund the purchases.

Make no mistake; liquidity flows will change as a result of the offerings, and that creates volatility.  The key questions are how quickly the balance sheet is restored (e.g. a few large offerings, or many small ones), and which institutions are buyers.  The answers to those unknowns will determine just how much volatility our portfolio’s experience.

Best to Your Week!

P.S. If you find this research helpful, please tell a friend.
If you don’t, tell an enemy.

Sources: Bloomberg, CNBC, Federal Reserve Bank of St. Louis, Hedgeye, T1 Alpha, U.S. Bureau of Economic Analysis, U.S. Bureau of Labor Statistics

Invest Safely, LLC is an independent investment research and online financial media company.  Use of Invest Safely, LLC and any other products available through invest-safely.com is subject to our Terms of Service and Privacy Policy.
Not a recommendation to buy or sell any security.
Posted in Historical Data, Market Trends | Tagged , , , , | Comments Off on Weekend Stock Market Outlook – June 4 2023

Weekend Stock Market Outlook – May 28 2023

Stock Market Outlook entering the Week of May 28th = Uptrend

      • ADX Directional Indicators: Uptrend
      • Price & Volume Signals: Uptrend
      • Elliott Wave Analysis: Mixed

ANALYSIS
The stock market outlook maintained an uptrend, with the S&P500 ($SPX) ending the week with a 0.3% gain.

The ADX is bullish, as is price/volume.  Distribution days are elevated (>5); something to keep an eye on.

Elliott Wave remains mixed.  There’s no stand-out case to be made at this point, so it’s best to let the market come to us on this signal.

COMMENTARY
Short trading week this week, and a short/late blog post this week on account of the Memorial Day holiday.

Last week, Nvidia blew out earnings estimates and raised guidance.  An impressive feat, given the lower performance from the competition (Intel, Advanced Micro Devices, Micron, etc.).   And the BEA publish April PCE, which was higher than expected.

Over the weekend, a high level agreement on the debt ceiling was reached.  Now it needs to pass through Congress…easier said than done these days.

Best to Your Week!

P.S. If you find this research helpful, please tell a friend.
If you don’t, tell an enemy.

Sources: Bloomberg, CNBC, Federal Reserve Bank of St. Louis, Hedgeye, T1 Alpha, U.S. Bureau of Economic Analysis, U.S. Bureau of Labor Statistics

Invest Safely, LLC is an independent investment research and online financial media company.  Use of Invest Safely, LLC and any other products available through invest-safely.com is subject to our Terms of Service and Privacy Policy.
Not a recommendation to buy or sell any security.
Posted in Historical Data, Market Trends | Tagged , , , , | Comments Off on Weekend Stock Market Outlook – May 28 2023

Weekend Stock Market Outlook – May 21 2023

Stock Market Outlook entering the Week of May 21st = Uptrend

      • ADX Directional Indicators: Uptrend
      • Price & Volume Signals: Uptrend
      • Elliott Wave Analysis: Mixed

ANALYSIS
The stock market outlook shifted to an uptrend last week, with the S&P rallying on talk of a U.S. debt ceiling resolution and dovish comments from the Fed chairman.

The S&P500 ($SPX) ended the week up 1.6%, after reaching a new high for the year at ~4213. Cycle to date (i.e. since the bear market began in January 2022), the index is:

    • -13% since the cycle peak (Jan 2022)
    • +20% from the cycle low (Oct 2022)
Technical analysis of daily SPX prices

SPX Price & Volume Chart for the Week of May 21 2023

The ADX is bullish to start the week, with some signs of strengthening trend from the main indicator.  Don’t read into that too much, since it’s coming off cycle lows, as well as lows for the year, and hasn’t surpassed April levels even though the index is higher (negative divergence).

Price/volume shifted to an uptrend thanks to Wednesday’s rally on “above-average” trading volume.  The FFTY index continues to lag, struggling to move beyond the 50-day moving average.

Technical analysis of daily SPX prices

SPX Elliott Wave Analysis for the Week of May 21 2023 – Bullish Count

Elliott Wave remains mixed, but not for lack of trading action. The SPX broke the 4196 resistance level by a few points, invalidating the prior bearish count. And the MACD shows a bullish cross-over occurred mid-week. That would typically be enough to shift the signal. However, the recent consolidation / wave extensions forced updates to both the bullish and bearish counts, and neither has an edge. Even without adjustments, there’s a potential negative divergence in the MACD histogram despite the bullish cross-over, as well as the RSI(5).  So the signal remains mixed.

COMMENTARY
The market signals FINALLY picked a side! Let’s see how long it lasts. The biggest concern for the stock market outlook is the index itself; specifically increasing concentration risk (i.e. a few really big companies accounting for all of the price movement).

Looking at the performance of the FFTY index (50 best “innovation”/”growth” companies) reveals that companies leading the market higher aren’t the typical “leading” stocks (i.e. small cap companies with cutting edge / innovative technology).  This is mirrored in a general sense by the relative underperformance of a small cap index (i.e. Russell 2000) versus a large cap index (i.e. S&P500).

But even within large cap indexes like the S&P500, price action is driven by a handful of stocks, resulting from increasingly lopsided market cap weightings.

For instance, last week’s gains were driven by stocks within the Technology ($XLK), Communications ($XLC), and Consumer Discretionary ($XLY) sectors.

Price charts for S&P500 sectors

S&P Sector Price Charts for the Week of May 21 2023

Per Hedgeye, the two largest market cap stocks (Apple & Microsoft) account for 14% of $SPX’s weighting.  Not to mention that Apple’s market capitalization is now greater than the entire Russell 2000 index!

And which sector is home to Apple and Microsoft? Technology ($XLK)…the best performer.  In fact, 8 of the 10 largest companies in the $SPX drive performance in those 3 sectors:

  • Technology ($XLK)
    • Apple, Microsoft, & Nvidia ($AAPL, $MSFT, $NVDA)
    • ~54% of the sector ETF
  • Communications ($XLC)
    • Google & Meta ($GOOG , $GOOGL, $META)
    • ~51% of the sector ETF
  • Consumer Discretionary ($XLY)
    • Amazon & Tesla ($AMZN, $TSLA)
    • ~40% of the sector ETF

Meanwhile the Energy ($XLE) and Industrial ($XLI) sectors have underperformed, price-wise, even though they’ve generated a majority of the $SPX earnings growth this year. Consumer discretionary is pulling it’s own weight so far.

But technology and communications?  They’re firmly in an earnings contraction, and are where a majority of recent layoffs have been centered.  Not exactly the “growth” engine you’d expect for a new bull market…

Best to Your Week!

P.S. If you find this research helpful, please tell a friend.
If you don’t, tell an enemy.

Sources: Bloomberg, CNBC, Federal Reserve Bank of St. Louis, Hedgeye, T1 Alpha, U.S. Bureau of Economic Analysis, U.S. Bureau of Labor Statistics

Invest Safely, LLC is an independent investment research and online financial media company.  Use of Invest Safely, LLC and any other products available through invest-safely.com is subject to our Terms of Service and Privacy Policy.
Not a recommendation to buy or sell any security.
Posted in Historical Data, Market Trends | Tagged , , , , | Comments Off on Weekend Stock Market Outlook – May 21 2023

Weekend Stock Market Outlook – May 14 2023

Stock Market Outlook entering the Week of May 14th = Downtrend

      • ADX Directional Indicators: Uptrend
      • Price & Volume Signals: Mixed
      • Elliott Wave Analysis: Mixed

ANALYSIS
The stock market outlook remains in a downtrend, with a mixed signal set, as it has for quite some time.

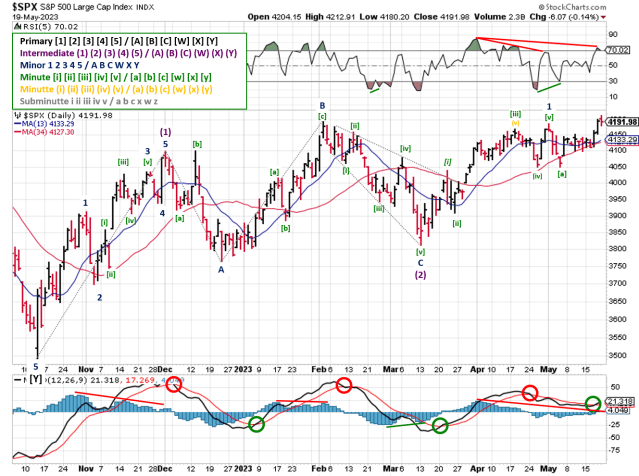
After some volatile sessions, the S&P500 ($SPX) ended the week down 0.3%.  The index is above key moving averages, but remains rangebound between 4200 and 4050.  It hasn’t been able to distance itself from the prior trendline of lower-highs either.

Technical analysis of daily SPX prices

SPX Price & Volume Chart for the Week of May 14 2023

The ADX is bullish to start the week.  Since the last update two weeks ago, the signal flip-flopped again (bullish to bearish to bullish),  The overall reading sits near cycle lows (Jan 2022), and confirms the lack of a “trend” so far this year.

Price/volume remains mixed; still in search of a breakout to the upside.  Institutional selling continued during the first week of May, and then receded last week.  Since mid-March, most high volume trading days have been to the downside. So-called leading stocks, as measured by the $FFTY, haven’t made any progress since February.

Elliott Wave remains mixed and messy.  Resistance at 4196 held, but so did support at 4050.  Taking at look at the longer-term counts, another adjustment is needed and therefore a redo of the short-term counts.

The March update addressed the longer than expected corrective waves (3-wave “flat” pattern).  Now that we have more price action to work with, the extended time frame makes sense if the pattern is a “triangle”, rather than a “flat”.

A triangle occurs during sideways price movements, and accompanied by decreasing volume and volatility (sound familiar?). Triangles have 5 waves, with each one subdivided into 3 parts (i.e. a 3-3-3-3-3 structure).

Example Elliott Wave Pattern - Ascending Triangle

Example Elliott Wave Pattern – Ascending Triangle

In this case, an ascending triangle, based on the index meeting resistance near 4200, along with a series of higher lows (flat top, rising bottom). The key question for a bullish versus bearish count is when did the pattern begin; at the November high, or at the October low?

COMMENTARY
No post last week due to some last minute travel; life happens and sometimes there aren’t enough hours in the day.  That said, not much has changed, with the market seemingly waiting for the next shoe to drop before deciding on a direction.

Lets recap some economic data with help from Hedgeye Risk Management:

  • ISM Manufacturing index increased from 46.3 to 47.1 in April
    • 6th straight month in “contraction” territory
  • ISM Services index rose from 51.2 to 51.9 in April
  • JOLTS fell to 9.59 in March; the lowest reading since April 2021
    • ~30% above long-term averages
  • April CPI decreased to 4.9% y/y ; Core CPI slowed to 5.5% y/y
  • April PPI decreased to 2.3% y/y; Core PPI slowed to 3.2% y/y
  • 90% of the SP500 has reported earnings; revenues are higher by +4.2% y/y, while earnings are lower by -3.2% y/y
  • And last but not least, the Fed raised rates another 0.25%

In summary, overall economic activity is essentially flat, and unemployment relatively low. Inflation continues to slow, but remains high versus targets. We have an earnings recession, even though companies are “beating” lowered analyst estimates. And the Fed’s higher for longer policy remains in place.  So the economic situation is tenuous, at best.

Unfortunately, the U.S. now faces the debt ceiling debacle.  A couple of months back, I mentioned the topic wasn’t worth discussing until we were closer to the deadline.  Well, it’s closer, since the amount of money generated by our taxes wasn’t as high as the U.S. Treasury expected.  Now the deadline is early June.

The recess/travel schedules of the legislative and executive branches of government leaves ~15 working days to solve the problem. And by solve the problem, I mean reach an agreement, form the necessary committees, reach consensus on specifics, submit those specifics to Congress for ratification, then get the ratified legislation to the President for approval.  Did I mention the 15 day timeframe?

You’d be forgiven for yawning after reading that paragraph.  After all, doesn’t this brinksmanship always lead up to the powers that be pulling out an 11th hour solution?  While that’s true, what caught my attention was the pricing of U.S. CDS; specifically the rate of change.

Credit Default Swaps (not to be confused with Certificates of Deposit) are used by investors to hedge or “insure” exposure to government debt, such as countries with large holdings in U.S. Treasuries like China or Japan.  PIMCO has an excellent primer on credit default swaps if you want more detailed info).

In the past, warnings were typically limited to countries that have defaulted in the past or struggled with currency issues like Brazil, Mexico, Greece, Italy, and Russia.

Last week, the spreads on 1-year U.S. CDS reached 172 basis points, which is an all-time high and up from 10 basis points 1 year ago(!).

The spread on the 5-year CDS hit 73 basis points; the highest level since 2009.   Now that doesn’t mean default is a given. In fact, the 173 basis points for the 1-year CDS implies that the overall probability of default is ~4% (Source: MSCI). But when rate of change data shows market participants are starting to hedge, it’s time to pay attention.

The concern for most investors is their money market funds, which are largely invested in U.S. treasuries. If an agreement isn’t reached, then the government will need to prioritize which bills get paid, and that includes interest on U.S. Treasuries. Seniors relying on social security payments also need to ensure they have additional funds in their checking accounts, just in case their payments are delayed/interrupted.

Happy Mother’s Day!

P.S. If you find this research helpful, please tell a friend.
If you don’t, tell an enemy.

Sources: Bloomberg, CNBC, Federal Reserve Bank of St. Louis, Hedgeye, T1 Alpha, U.S. Bureau of Economic Analysis, U.S. Bureau of Labor Statistics

Invest Safely, LLC is an independent investment research and online financial media company.  Use of Invest Safely, LLC and any other products available through invest-safely.com is subject to our Terms of Service and Privacy Policy.
Not a recommendation to buy or sell any security.
Posted in Historical Data, Market Trends | Tagged , , , , | Comments Off on Weekend Stock Market Outlook – May 14 2023

Weekend Stock Market Outlook – April 30 2023

Stock Market Outlook entering the Week of April 30th = Downtrend

      • ADX Directional Indicators: Uptrend
      • Price & Volume Signals: Mixed
      • Elliott Wave Analysis: Mixed

ANALYSIS
The stock market outlook remains in a downtrend thanks to a mixed signal set.  But the S&P500 sits at an inflection point, so expect a trend to establish itself this week.

After some volatile sessions, the S&P500 ($SPX) ended the week with a gain of 0.9%.  The index remains above the 50 and 200-day moving averages.

Technical analysis of daily SPX prices

SPX Price & Volume Chart for the Week of April 30 2023

ADX shows a bullish trend, although the direction indicators flipped during the week.

Price/volume remains mixed, despite last week’s performance.  Trading volume was above average last week (finally), showing that institutional traders were active participants.  On the bullish side, the index remains above the 50-day moving average, and Thursday’s action could be considered a follow-through day.  On the bearish side, said rally attempt started back in mid-March, so the market’s well outside the 4-10 day window.

When the technicals aren’t clear, take a look below the surface at the behavior of innovative growth companies (i.e. “leading stocks”).  The $FFTY serves as a proxy for market leadership, and it doesn’t support a bullish narrative.  That index remains rangebound, and still needs to break resistance at the 50-day moving average.

Technical analysis of daily FFTY prices

FFTY Price & Volume Chart for the Week of April 30 2023

No change in Elliott Wave entering the week either, although the SPX is at an inflection point.  Bearish technical indicators solidify the bearish count showing a completed Minor 2 on April 18. And the MACD crossed-over, confirming the RSI(5)’s bearish divergence during early April.

Technical analysis of daily SPX prices

SPX Elliott Wave Analysis for the Week of April 30 2023 – Bearish Pattern

As of Friday’s close, the SPX appears to have completed a Minute [ii] wave in the bearish count.  The typical retracement for a second wave is 61.8%-100% of the first wave. So for the current Minute [ii], the target was 4123-4169.48. The SPX closed Friday’s session at…*checks chart*…4169.48(!).  While this level needs to hold, the count is further strengthened by a second negative divergence in the RSI(5), increases the probability of a completed 2nd wave.

Of course, the fact that the index sits at 100% retracement also makes the bearish count very “fragile”, as there’s little room to the upside!  The bull count isn’t invalid just yet, despite the increasingly bearish tone set by the technical indicators.  Both counts need to survive a handful of market moving events this week.

COMMENTARY
March PCE data shows that inflation continues to decline from peak levels, but remains high. Headline numbers were higher than expected (+4.2% Y/Y), but was lower than the 5.1% increased in February. Core PCE was up 4.6% Y/Y; down slightly from February.

First quarter GDP showed the U.S. economy is growing, at a slow pace…kind of like inflation.  Q1 GPD increased +1.6% Y/Y, versus +0.9% Y/Y in Q4 2022.  Interestingly, government spending accounted for 0.81% of the increase.  The annualized SAAR, which is the number widely reported by the media, showed an increased of +1.1%, well below the Q4 level of +2.6%.

So far, Q1 earnings have exceeded analyst estimates, although most of those estimates were lowered last quarter so it’s not as impressive as it sounds.  With just over half the S&P500 companies reporting, revenue growth is up about 5%, while earnings are contracting (-3%).  The Energy and Industrial sectors are up 51% and 26% respectively, otherwise the earnings contraction would be much worse (Source: Hedgeye Risk Management).

Mega-cap tech stocks, which account for a large part of the S&P’s performance, helped the index rally last week. But this week is all about Apple, which releases earnings on Thursday, May 4th.  The company accounts for almost 7% of the S&P500’s total market cap!

They’ll be a lot of economic data released this week as well.  ISM Manufacturing & Services indexes come out on Monday and Wednesday, respectively.  JOLTS data is released on Tuesday.  On Wednesday, the Fed’s latest rate decision is announced.  Non-farm payrolls come out on Friday.

First, the market needs to absorb another bank failure.  After market close on Friday, Reuters broke the news that the U.S. Federal Deposit Insurance Corporation (FDIC) was preparing to put First Republic Bank ($FRC) into receivership.

Best To Your Week!

P.S. If you find this research helpful, please tell a friend.
If you don’t, tell an enemy.

Sources: Bloomberg, CNBC, Federal Reserve Bank of St. Louis, Hedgeye, T1 Alpha, U.S. Bureau of Economic Analysis, U.S. Bureau of Labor Statistics

Invest Safely, LLC is an independent investment research and online financial media company.  Use of Invest Safely, LLC and any other products available through invest-safely.com is subject to our Terms of Service and Privacy Policy.
Not a recommendation to buy or sell any security.
Posted in Historical Data, Market Trends | Tagged , , , , | Comments Off on Weekend Stock Market Outlook – April 30 2023