Stock Market Outlook: February 1st = Uptrend
The stock market outlook continues to show an uptrend in place for the S&P500, indicated by bullish designations for 2 of 3 technical indicators.
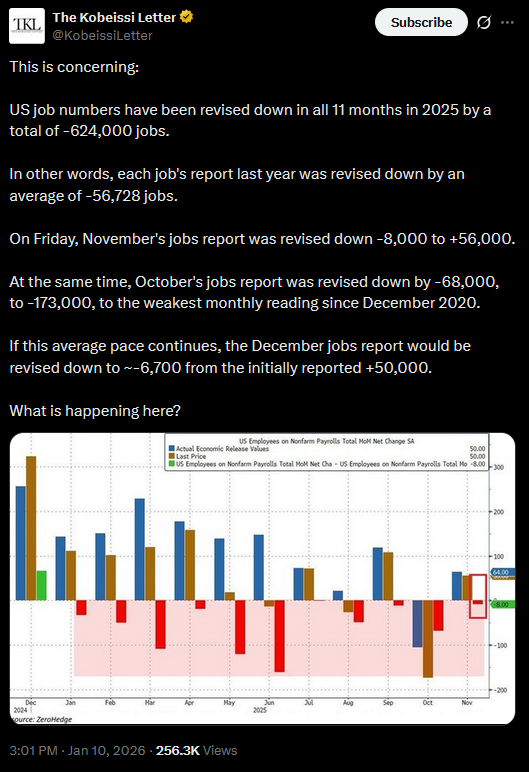
Oil, Energy, and High Dividend payers outperformed, metals / crypto crashed, reaction to earnings was mixed, and the FOMC held rates steady. A partial government shutdown, ISM survey results and jobs data will shape the week ahead.
TREND ANALYSIS
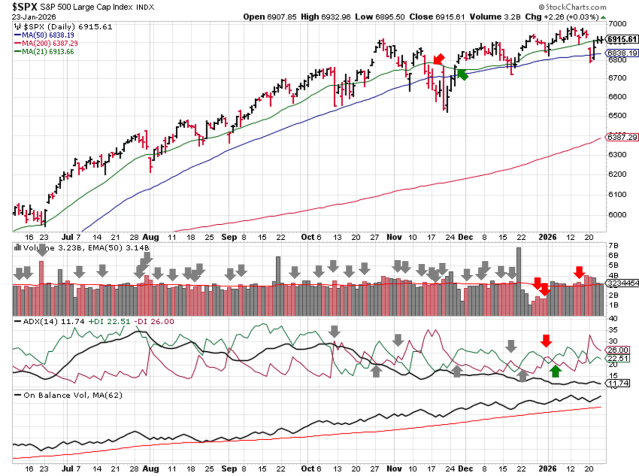
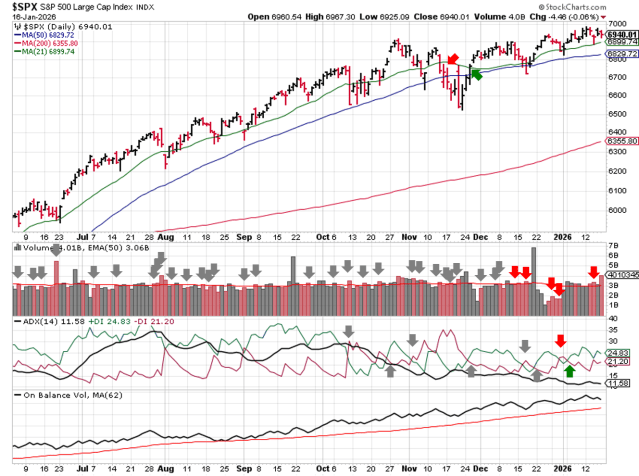
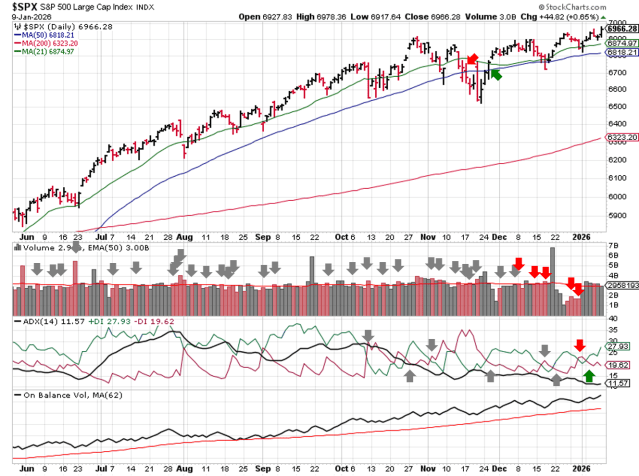
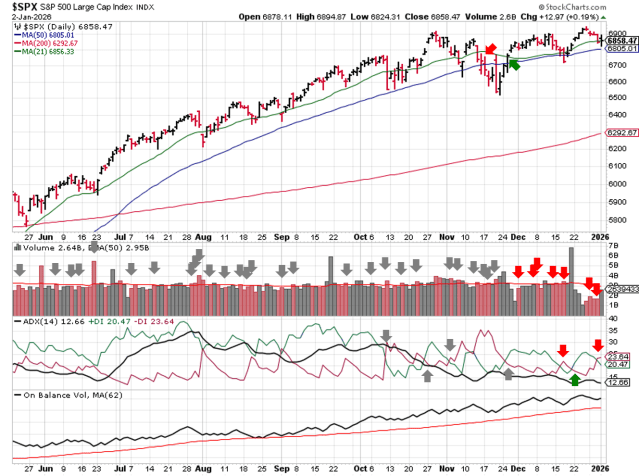
The S&P500 ( $SPX ) rose 0.3% last week, continuing to trade above key levels:
- ~1% above the 50-day moving average
- ~8% above the 200-day moving average
Despite the volatile price action, indicators start the week unchanged:
- Average Directional Index: Bearish
- ADX direction indicators flipped to bearish during the week, but reversed on Thursday
- Institutional Activity: Bullish
- Selling volume increased last week, but only triggered one distribution day and price remains above the 50 dma, keeping a bullish trend in place
- On-Balance Volume: Bullish
- On-balance volume remains above its trendline
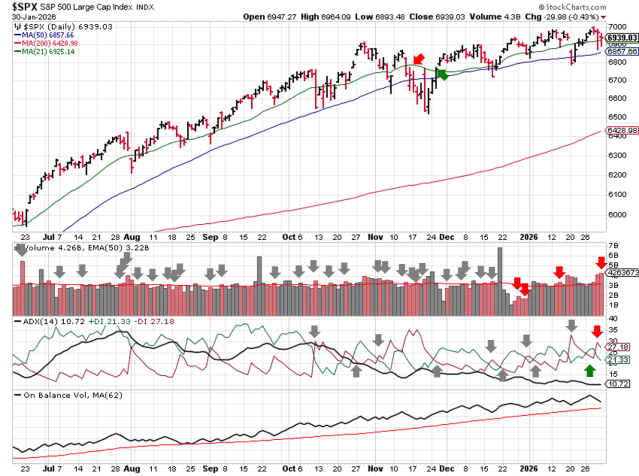
SPX Price & Volume Chart for 2026-02-01
PERFORMANCE HIGHLIGHTS & COMPARISONS
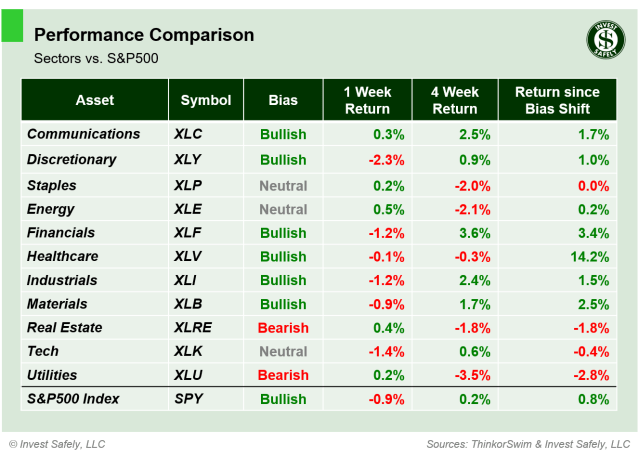
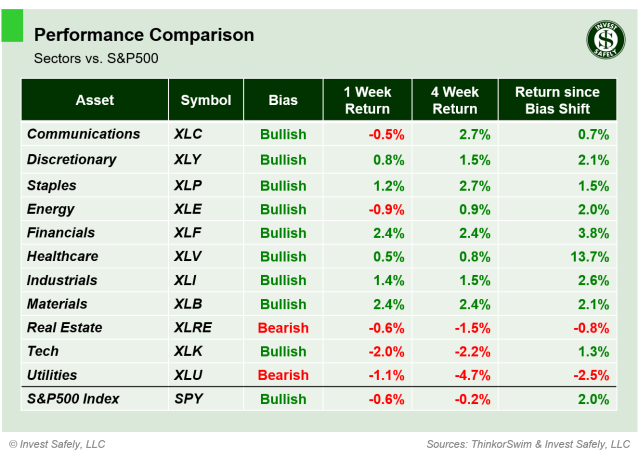
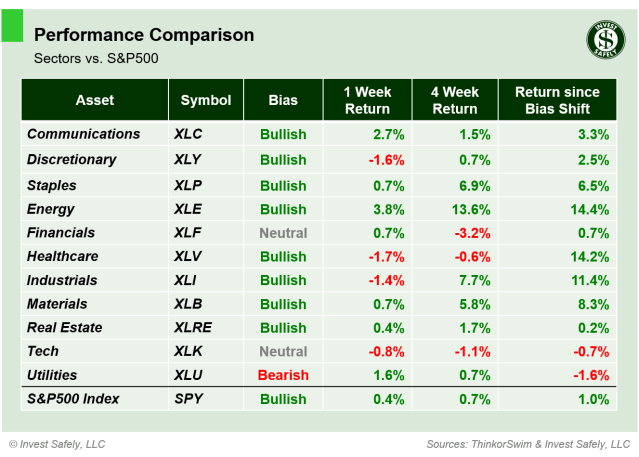
S&P500 Sectors
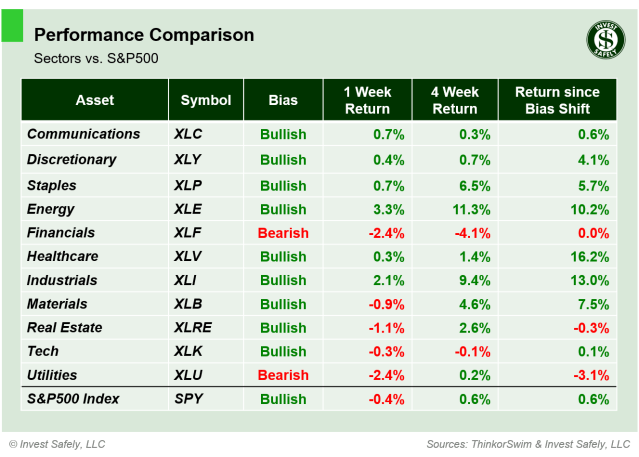
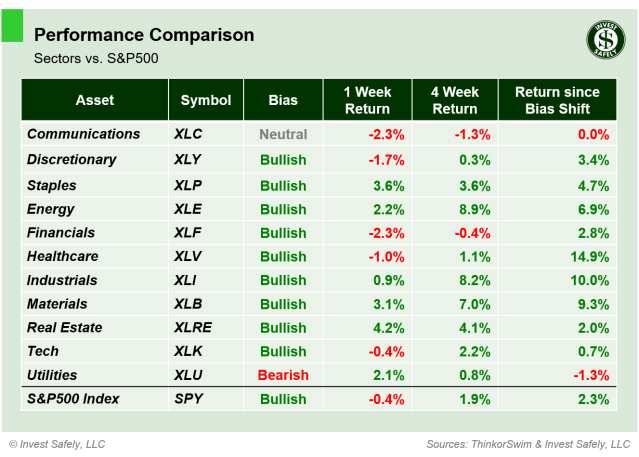
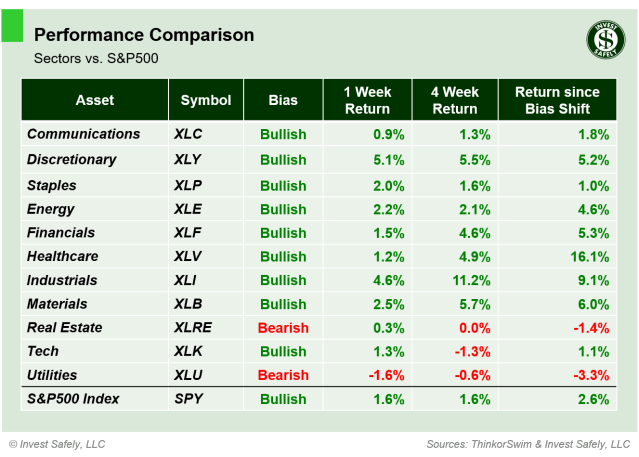
Energy ( $XLE ) outperformed for the second consecutive week; Healthcare ( $XLV ) underperformed. Technology ( $XLK ) eased back to neutral after a slew of Mag 7 earnings, while Financials ( $XLF ) regained neutral bias.
S&P Sector Performance – 2026-02-01
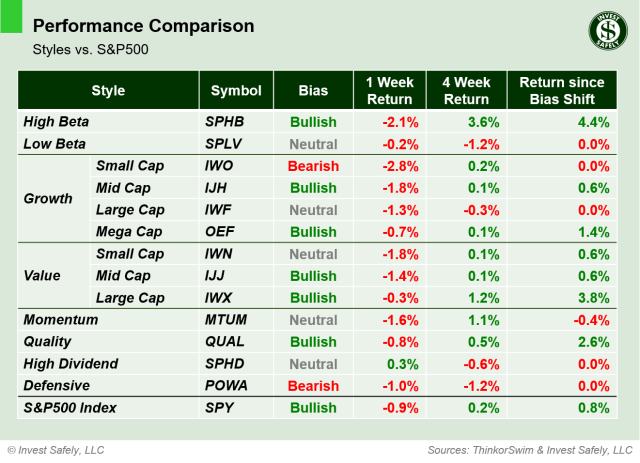
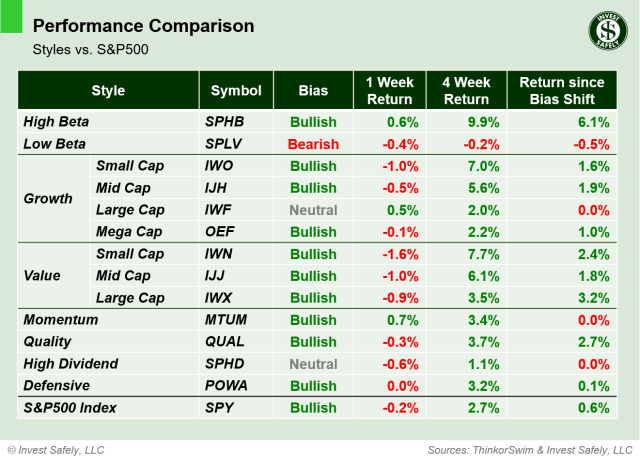
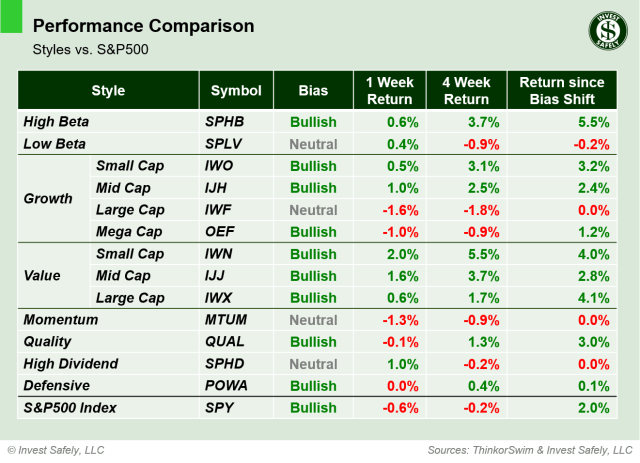
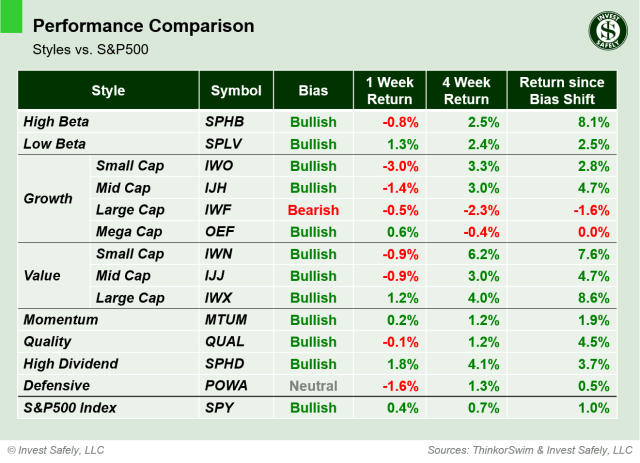
S&P500 Investing Styles
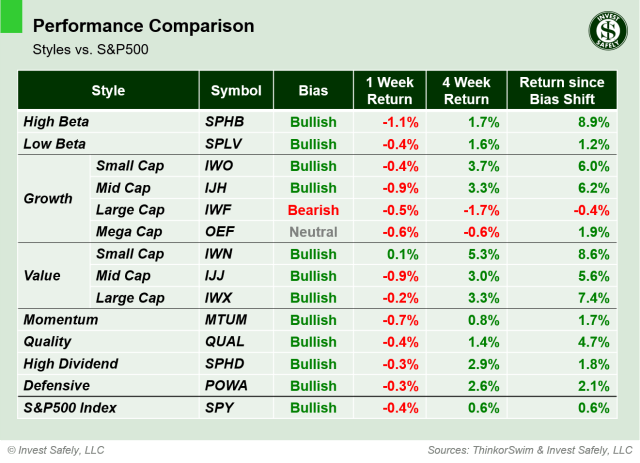
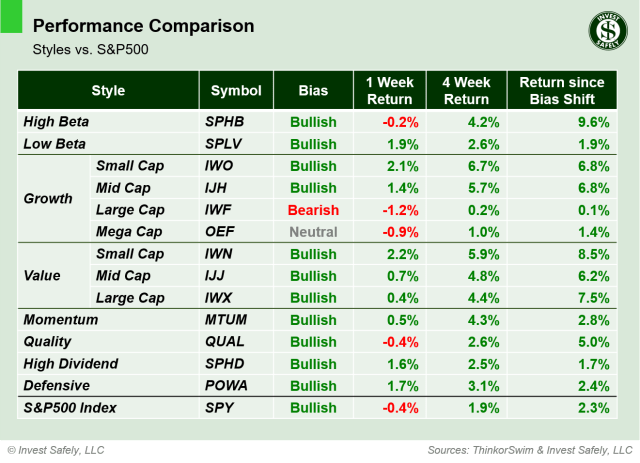
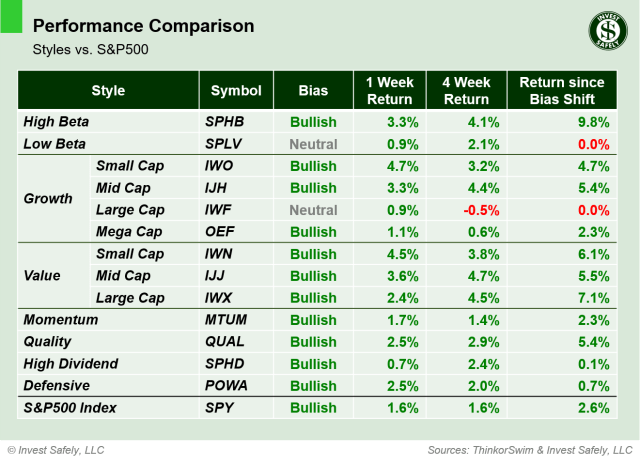
High Dividend ( $SPHD ) led upside performance, which hasn’t happened in a long time. But it was Small Cap Growth falling 3% that really stood out within sector styles. Mega Cap Growth ( $OEF ) returned to bullish bias, and Defensives ( $POWA ) hit neutral.
Sector Style Performance – 2026-02-01
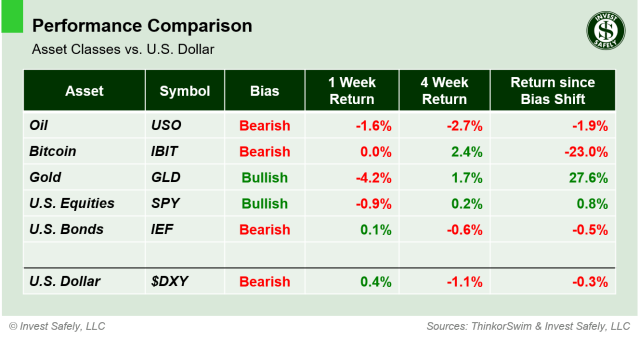
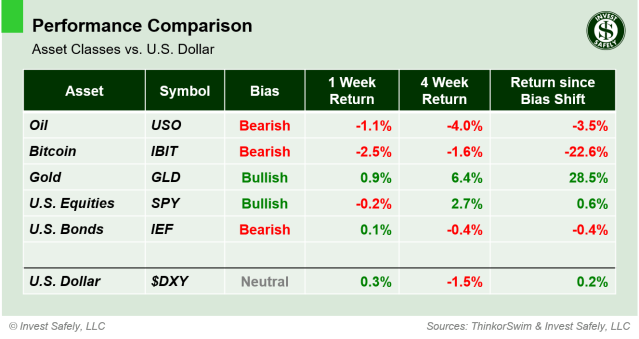
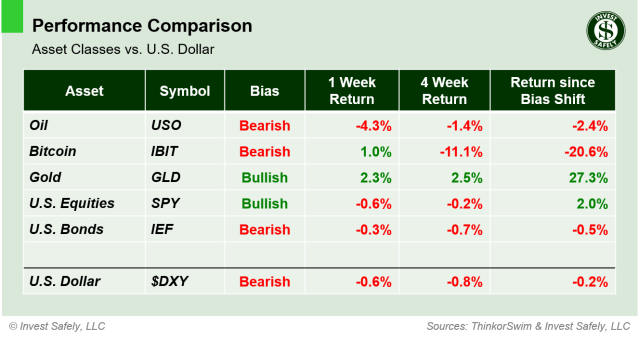
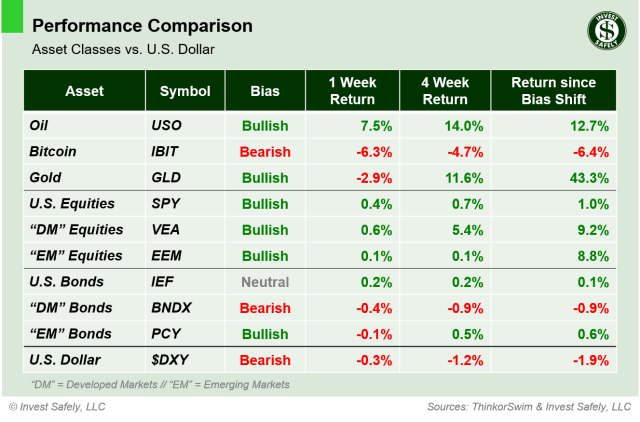
Asset Classes
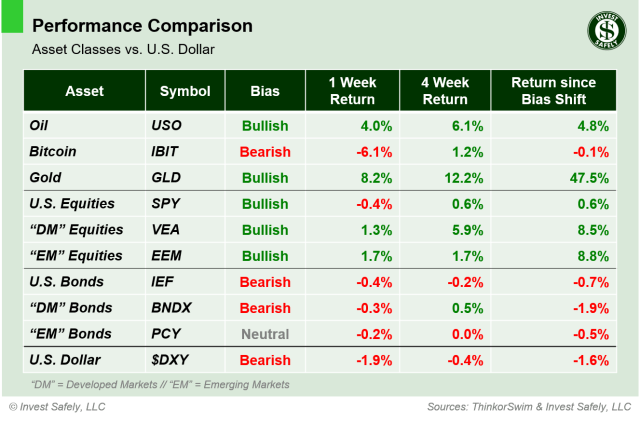
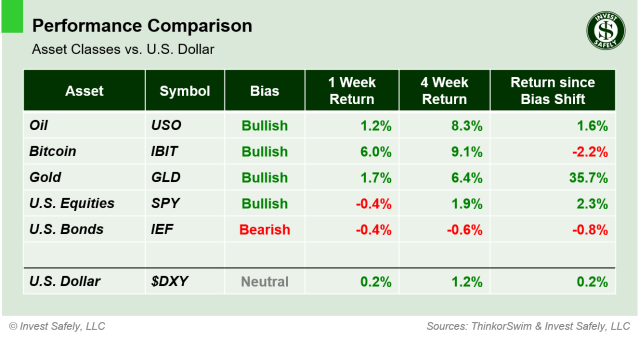
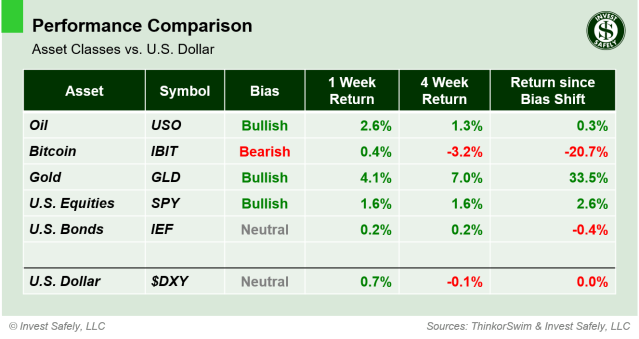
The moves in metals continue to dominate global headlines. Oil ( $USO ) quietly led asset classes higher last week, gaining almost 8%. Bitcoin ( $IBIT ) was the biggest loser, as the leverage continues to be unwound across the cryptocurrency space. U.S. Bonds ( $IEF ) moved up to neutral bias, and EM bonds ( $PCY ) improved to bullish.
Asset Class Performance vs. U.S. Dollar – 2026-02-01
COMMENTARY
Markets
The metals rally we discussed last weekend reversed violently on Thursday: Silver futures collapsed from a high of $121.79 to a low of $74! That’s a 39% peak‑to‑trough unwind in less than 2 days. Platinum’s overall move was similar, but took a few more sessions.
Macroeconomic Data & Policy
Mega‑cap tech delivered generally good headline numbers, but weaker than expected guidance and/or margin compression caused a few names to sell off.
December PPI rose 3.0% year-on-year, unchanged from November but higher than expectations for 2.7%. Increases in services prices drove the surprise upside.
The FOMC held rates steady and emphasized a data‑dependent path forward. On Friday, President Trump announced Kevin Warsh as his nominee to replace Powell as head of the Federal Reserve. A lot of ink was spilled on what Mr. Warsh has said in the past, regarding Fed policy. What he will do if/once he’s confirmed as Chairman is another matter. The current expectation is a mix: hawkish on the balance sheet ( reducing liquidity ) and dovish on interest rates ( potential cuts ).
Geopolitics
A partial U.S. government shutdown began over the weekend; a funding package passed the Senate late Friday, but still needs approval from the House of Representatives on Monday.
EYES ON THE HORIZON
This week brings several important data releases:
- Monday: ISM Manufacturing PMI
- Tuesday: December JOLTs Job Openings
- Wednesday: ISM Services PMI
- Thursday: —
- Friday: Non Farm Payrolls & Michigan Consumer Sentiment
Best to Your Week!