Weekend Stock Market Outlook – July 28 2024

Stock Market Outlook entering the Week of July 28th = Uptrend

  • ADX Directional Indicators: Downtrend
  • On Balance Volume Indicator: Mixed
  • Institutional Activity (Price & Volume): Uptrend

ANALYSIS
The stock market outlook still shows an uptrend, though the mix of signals foreshadows a change in direction if the rotation out of mega-cap stocks continues.

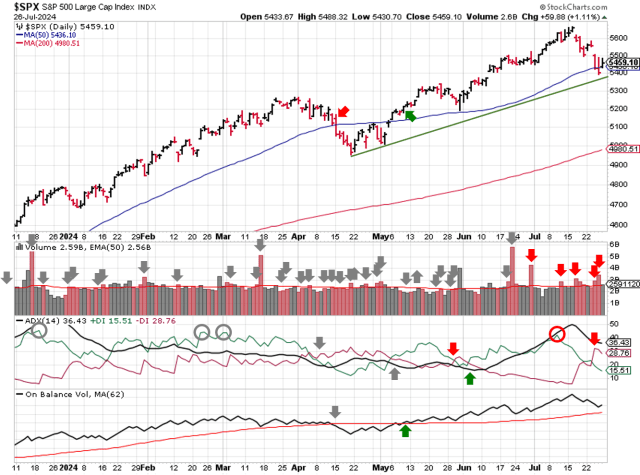
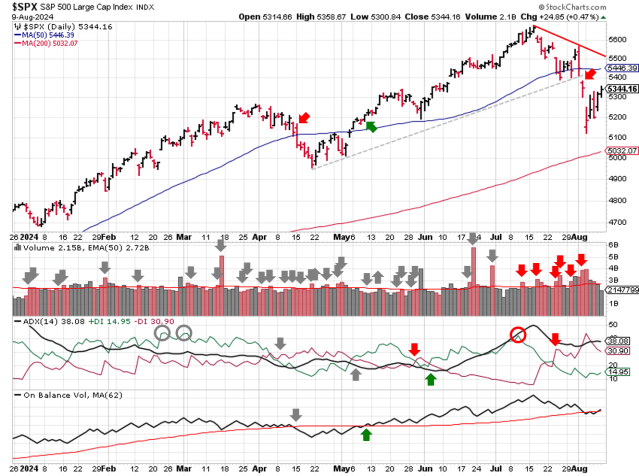
The S&P500 ($SPX) lost 0.8% last week.  The index now sits ~0.5% above the 50-day moving average and ~9.5% above the 200-day moving average.  Buyers didn’t defend the 5500 level, through support did emerge near 5400.

Technical analysis of daily SPX prices

SPX Price & Volume Chart for the Week of July 28 2024

The ADX shifts to a downtrend, reflecting the downward price action. On balance volume shows selling pressure as well, but remains bullish for now.

Institutional activity moves to mixed; 5 distribution days isn’t extreme, but higher than average trading volume on most down days adds to the bearish case.  Buyers stepped in on Friday, but volume was lower relative the selling on Wednesday and Thursday.

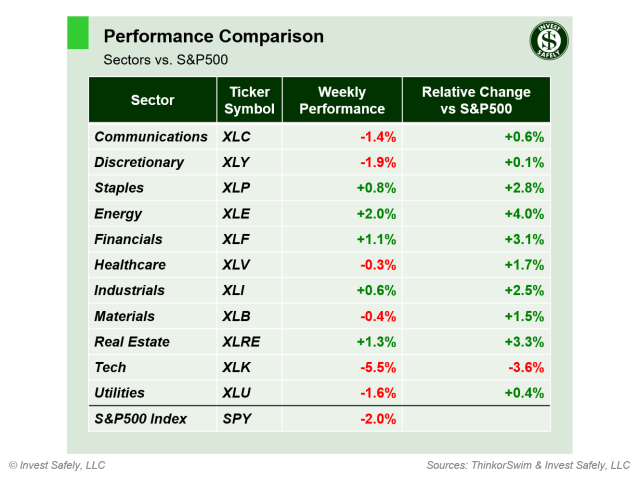
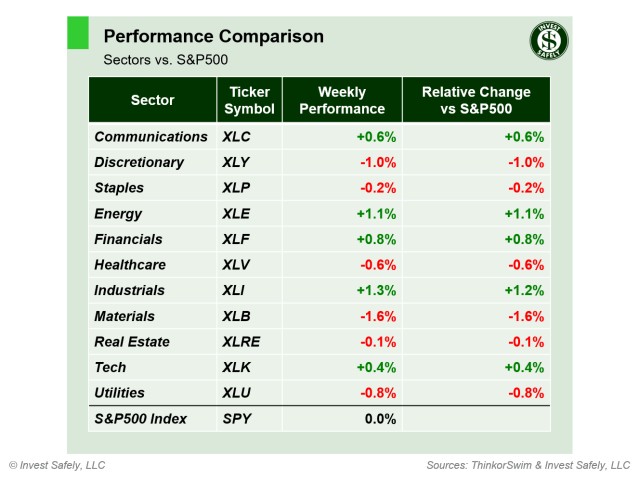
Weekly price performance of S&P500 sector ETFs

S&P Sector Performance for Week 30 of 2024

Last week’s decline was limited to just a few sectors, again showing the impact of market concentration in the Mag 7 stocks.  Tech was the worst sector ($XLK), while healthcare ($XLV) and materials ($XLB) led the way higher, just edging out financials ($XLF) and industrials ($XLI).

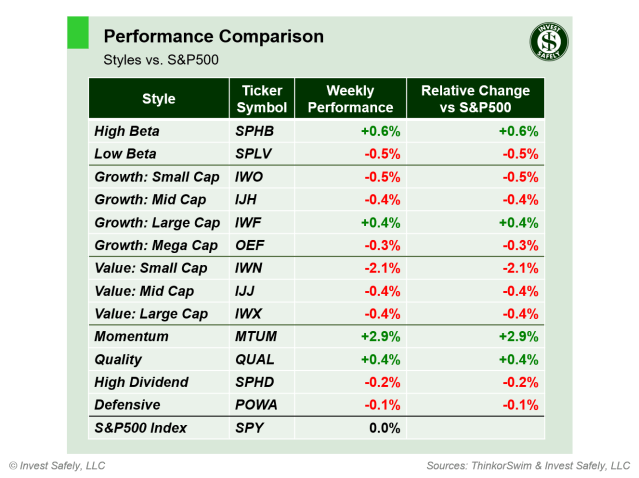
Weekly price performance by sector style

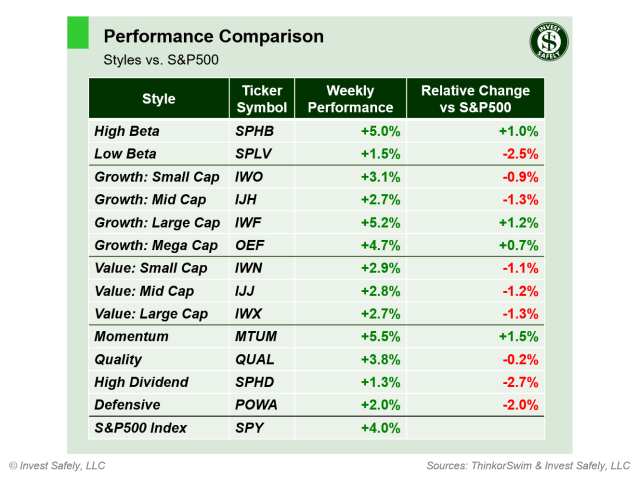
Sector Style Performance for Week 30 of 2024

Small caps led all sector styles…again.  Large cap and momentum styles underperformed…again.  The rotation out of Mag 7 names continued last week, as evidenced by the sector performance mentioned above.

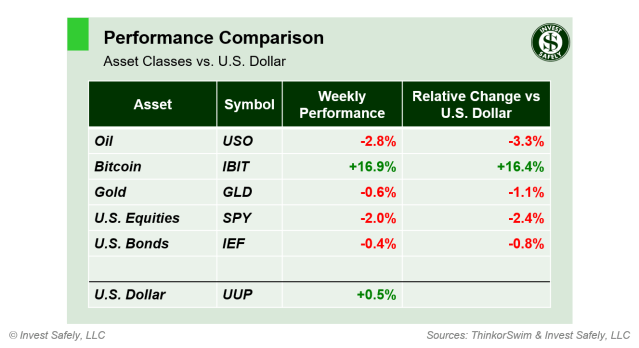
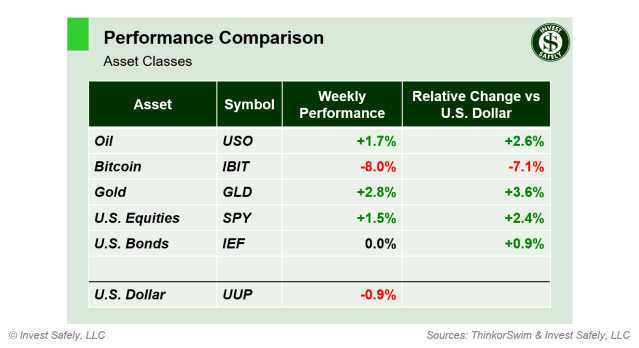
Weekly price performance by asset class

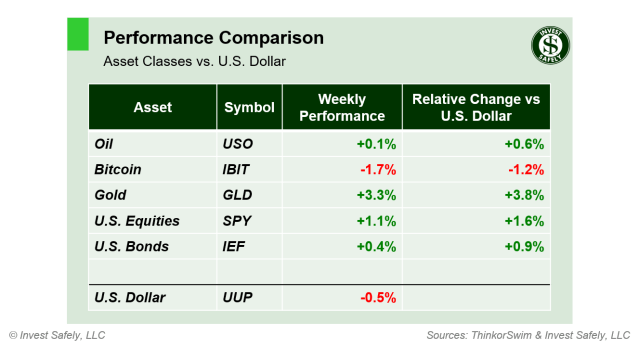
Asset Class Performance for Week 30 2024

Bitcoin led to the upside, but nowhere near the double digit gain registered during the week of July 15th.  Oil, which read through to commodities in general, declined the most.

COMMENTARY
As noted above, the last week’s losses weren’t evenly distributed, thanks to the market-weighting of Mag 7 stocks.  The April low near 5000 was the last major support level for the S&P500, which also happens to be where the 200-day moving average is currently located.  Just a reminder that there’s another 10% downside possible before we know if this is a garden variety correction or something more.

Look for more volatility this week, with another 4 of the Magnificent 7 releasing their latest quarterly earnings ($AAPL, $AMZN, $META, $MSFT).

Durable Goods orders cratered in June, falling 6.6%.  A drop in orders for transportation equipment (automotive and aerospace) was the main culprit.

The first Q2 GDP estimate showed the economy expanded at an annualized pace of 2.8%, much higher than the final 1.4% figure in Q1.  Most concerning is the increase in government spending at 3.1%, rising from 1.8%.

June PCE data showed a small increased month over month, but the yearly figures show inflation remains sticky.  The Fed Fund futures market continues to predict rate cuts are eminent, which will be put to the test by the FOMC interest rate decision on Wednesday.

PCE (y/y) Actual Prior
Expected
Headline +2.5% +2.6% +2.5%
Core +2.6% +2.6% +2.5%

Additional economic data due this week includes June JOLTs data on Tuesday, ISM Manufacturing PMI on Thursday, and July NFP on Friday.

Best to Your Week!

P.S. If you find this research helpful, please tell a friend.
If you don’t, tell an enemy.
Sources: Bloomberg, CNBC, Federal Reserve Bank of St. Louis, Hedgeye, Stockcharts.com, U.S. Bureau of Economic Analysis, U.S. Bureau of Labor Statistics

Invest Safely, LLC is an independent investment research and online financial media company.  Use of Invest Safely, LLC and any other products available through invest-safely.com is subject to our Terms of Service and Privacy Policy.
Not a recommendation to buy or sell any security.
Posted in Historical Data, Market Trends | Tagged , , , | Comments Off on Weekend Stock Market Outlook – July 28 2024

Weekend Stock Market Outlook – July 21 2024

Stock Market Outlook entering the Week of July 21st = Uptrend

  • ADX Directional Indicators: Mixed
  • On Balance Volume Indicator: Uptrend
  • Institutional Activity (Price & Volume): Uptrend

ANALYSIS
The stock market outlook shows an uptrend in place for U.S. equities, despite the sell-off in big tech.

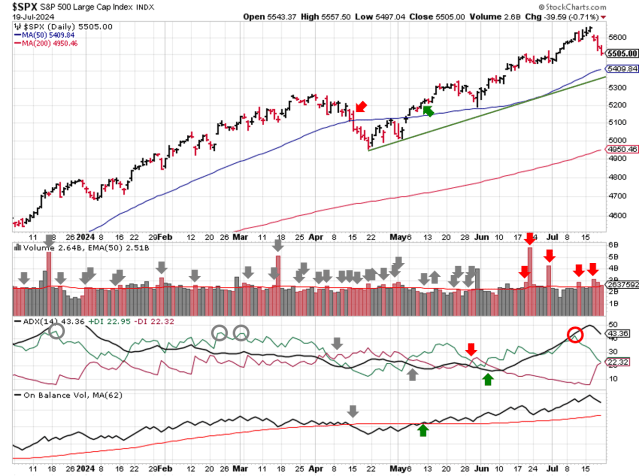
The S&P500 ($SPX) fell 2% last week.  The index now sits ~2% above the 50-day moving average and ~11% above the 200-day moving average. Nevertheless, the index remains historically extended from the 200-day, so further downside can’t be ruled out.  5500 is an important accumulation level from late June, so keep an eye of price behavior next week to see if buyers step in.

Technical analysis of daily SPX prices

SPX Price & Volume Chart for the Week of July 21 2024

The ADX shifts to mixed, reflecting the downward price action.  Institutional activity was also negative, although not enough to change the signal.  Thursday and Friday’s session aren’t considered distribution days due to declining trading volumes, but they still indicate higher than average selling pressure.

Weekly price performance of S&P500 sector ETFs

S&P Sector Performance for Week 29 of 2024

Digging into last week’s decline shows a wide range of performance.  Tech was the worst sector ($XLK) by far, largely due to negative headlines concerning the semiconductor industry.  Energy was the best sector ($XLE), which was a surprise given oil’s performance (see below), followed closely by real estate ($XLRE) and financials ($XLF).

Weekly price performance by sector style

Sector Style Performance for Week 29 of 2024

Small caps continued their rally, leading all sector styles.  Large cap and momentum styles underperformed, largely due to their weighting toward technology and semiconductor companies.

Weekly price performance by asset class

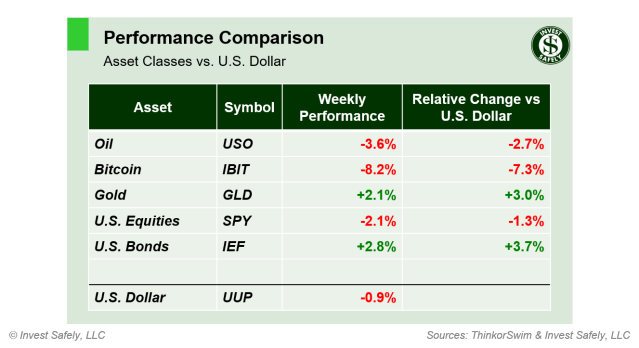
Asset Class Performance for Week 29 2024

And from an asset class view, Bitcoin led the way again, climbing ~17% and reminding everyone why it’s still a risk asset and not a store of value yet.  Oil was the worst asset class, dropping almost 3%.

COMMENTARY
Earnings season is in full swing, which 2 of the Mag 7 set to report this week: Tesla and Alphabet ($TSLA / $GOOGL).

No major economic news last week; June retail sales fell slightly in June (2.3% vs. 2.6% y/y), and weekly data showed a small increase in jobless claims.  This week we’ll get Durable Goods orders and the first Q2 GDP estimate Thursday morning, followed by the all important June PCE data Friday morning.

Best to Your Week!

P.S. If you find this research helpful, please tell a friend.
If you don’t, tell an enemy.
Sources: Bloomberg, CNBC, Federal Reserve Bank of St. Louis, Hedgeye, Stockcharts.com, U.S. Bureau of Economic Analysis, U.S. Bureau of Labor Statistics

Invest Safely, LLC is an independent investment research and online financial media company.  Use of Invest Safely, LLC and any other products available through invest-safely.com is subject to our Terms of Service and Privacy Policy.
Not a recommendation to buy or sell any security.
Posted in Historical Data, Market Trends | Tagged , , , | Comments Off on Weekend Stock Market Outlook – July 21 2024

Weekend Stock Market Outlook – July 14 2024

Stock Market Outlook entering the Week of July 14th = Uptrend

  • ADX Directional Indicators: Uptrend
  • On Balance Volume Indicator: Uptrend
  • Institutional Activity (Price & Volume): Uptrend

ANALYSIS
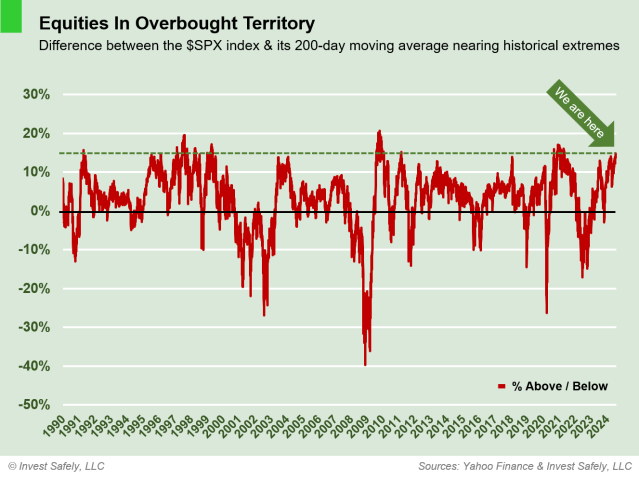
The stock market outlook shows an uptrend in place for U.S. equities, as the index nears historical extremes verses a well known technical indicator.

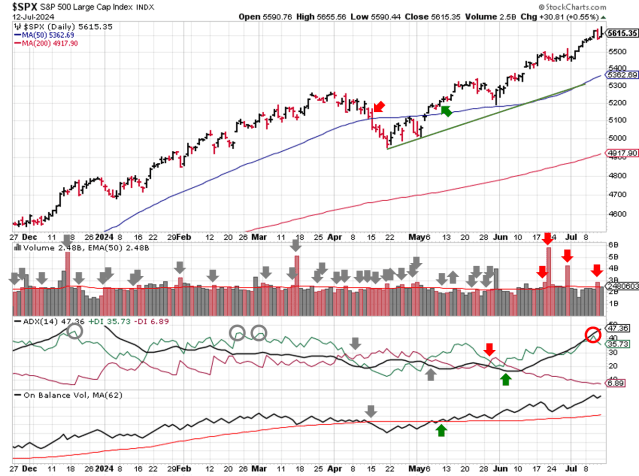
The S&P500 ($SPX) rallied 0.9% last week.  The index now sits ~5% above the 50-day moving average and ~14% above the 200-day moving average.

Technical analysis of daily SPX prices

SPX Price & Volume Chart – July 14 2024

All three indicators (ADX, On Balance Volume and Institutional activity) remain bullish.  That said, remember the SPX doesn’t spend much time this far above the 200-day.  We last noted the 14% level in the March 24th weekend update, just prior to the April correction.

Technical analysis of daily SPX prices

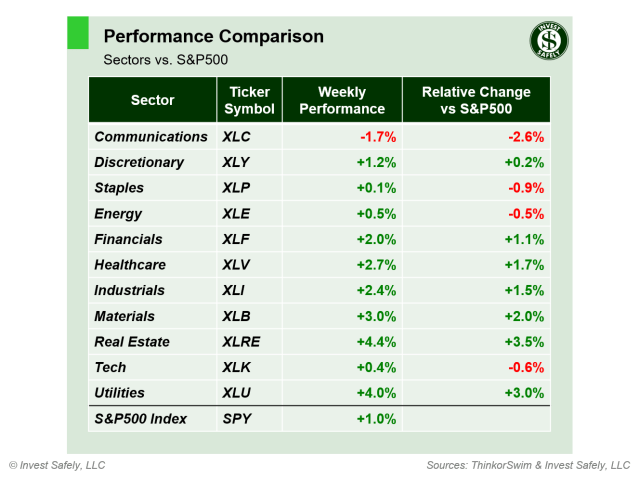
Last week’s advance saw the return of market breadth, with recent winners (e.g. $XLC, $XLK) lagging and oversold sectors leading.  Of course, the drop in interest rates helped rate sensitive sectors (e.g. $XLRE, $XLU), but materials and health care also performed well.

Weekly price performance of S&P500 sector ETFs

S&P Sector Performance for Week 28 of 2024

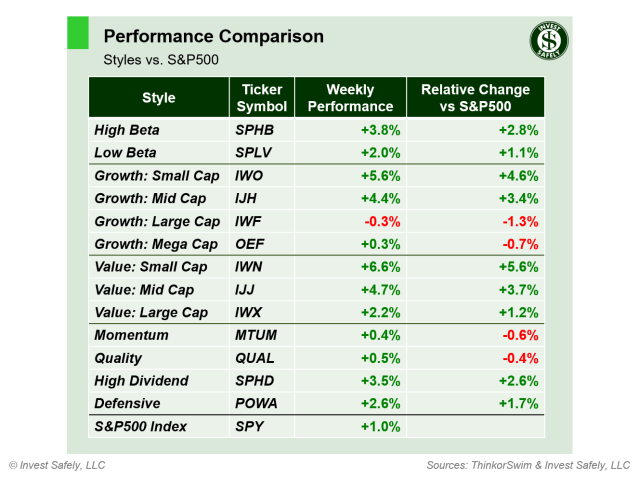
This shift in market breadth benefited small caps the most, with growth and value names significantly outperforming other styles.  On the other side of the coin, large/mega cap growth names underperformed, along with safety plays like quality and momentum.

Weekly price performance by sector style

Sector Style Performance for Week 28 of 2024

Bitcoin led all asset classes, after 5 weeks on the downside, while oil underperformed.

Weekly price performance by asset class

Asset Class Performance for Week 28 2024

COMMENTARY
Federal Reserve Chair Powell didn’t rock the boat with any of his comments last week, instead towing the line of data dependency.  Market odds for a September rate cut have increased, although inflation readings continue to show signs of “stickiness”.

The consumer price index (CPI) fell for a third straight month, down to 3% y/y in June, from 3.3% y/y in May.

CPI (y/y) Actual Prior
Expected
Headline +3.0% +3.3% +3.1%
Core +3.3% +3.4% +3.4%

On the other hand, Producer prices (PPI) increased 2.6% y/y in June, rising from 2.4% in May (and that’s after May’s number was revised higher from 2.2% to 2.4%).

PPI (y/y) Actual Prior
Expected
Headline +2.6% +2.4%* +2.3%
Core +3.0% +2.6%* +2.5%

In terms of price action, Thursday’s session was most interesting.  The SPX ended the day down, despite ~80% the companies in the index closing higher.  This dynamic is the market breadth issue we’ve been seeing recently, only this time in the negative direction.  The largest market capitalization stocks (i.e. Mag 7) encountered aggressive selling, thereby taking the index along for the ride.

Best to Your Week!

P.S. If you find this research helpful, please tell a friend.
If you don’t, tell an enemy.
Sources: Bloomberg, CNBC, Federal Reserve Bank of St. Louis, Hedgeye, Stockcharts.com, U.S. Bureau of Economic Analysis, U.S. Bureau of Labor Statistics

Invest Safely, LLC is an independent investment research and online financial media company.  Use of Invest Safely, LLC and any other products available through invest-safely.com is subject to our Terms of Service and Privacy Policy.
Not a recommendation to buy or sell any security.
Posted in Historical Data, Market Trends | Tagged , , , | Comments Off on Weekend Stock Market Outlook – July 14 2024

Weekend Stock Market Outlook – July 07 2024

Stock Market Outlook entering the Week of July 7th = Uptrend

  • ADX Directional Indicators: Uptrend
  • On Balance Volume Indicator: Uptrend
  • Institutional Activity (Price & Volume): Uptrend

ANALYSIS
The stock market outlook shows an uptrend in place for U.S. equities.

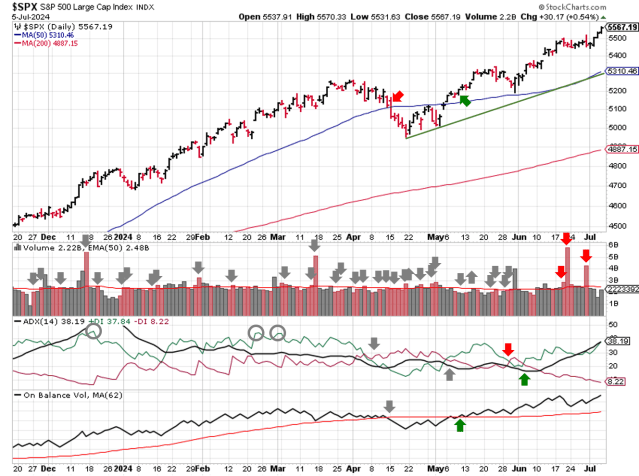
The S&P500 ($SPX) rallied 2.0% during last week’s holiday-shortened sessions.  The index now sits ~5% above the 50-day moving average and ~14% above the 200-day moving average.

Technical analysis of daily SPX prices

SPX Price & Volume Chart for the Week of July 07 2024

All three indicators (ADX, On Balance Volume and Institutional activity) remain bullish.

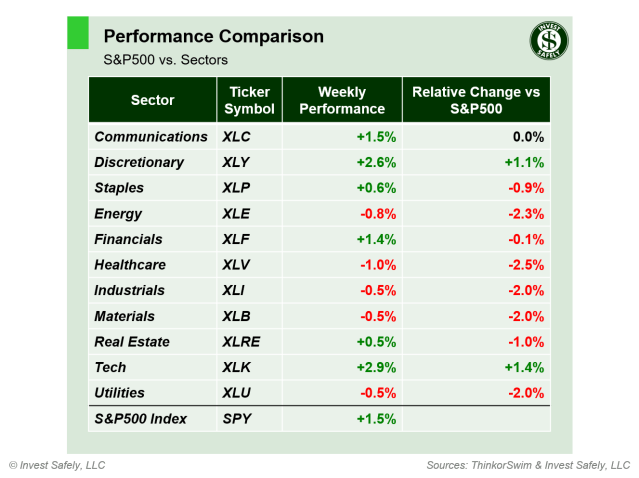
Industry sector performance highlights some recent concern over market breadth for equities, as the only categories outperforming the index are also home to Mag 7 stocks ($XLK, $XLY).

Weekly price performance of S&P500 sector ETFs

S&P Sector Performance for Week 27 of 2024**

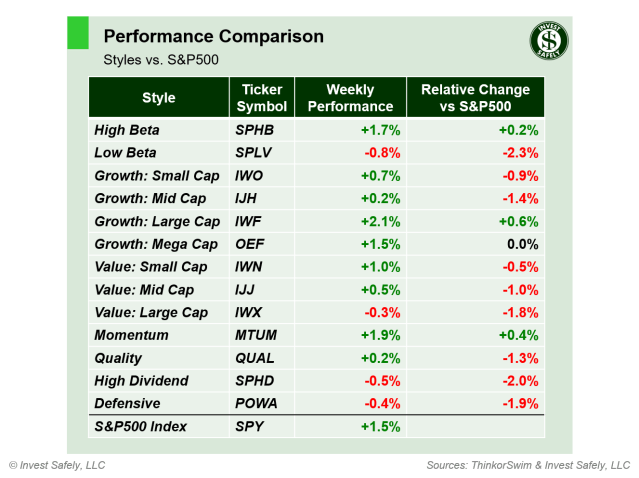
Considering the limited gains noted above, it’s no surprise that large cap growth stocks were the outperformers on a sector style basis (e.g. $IWF).

Weekly price performance by sector style

Sector Style Performance for Week 27 of 2024**

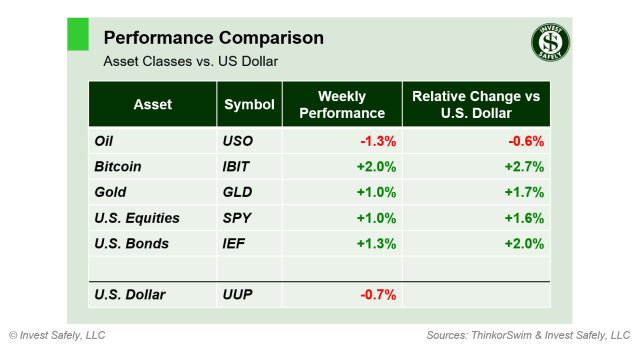
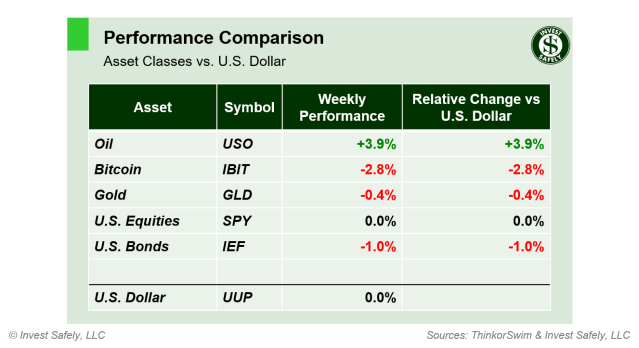
Most asset classes benefited from the drop in the U.S. dollar (i.e. inverse correlation at play), while the correction in Bitcoin completed it’s 4th week.

Weekly price performance by asset class

Asset Class Performance for Week 27 of 2024**

**NOTE: Due to the holiday-shortened trading week (4-days), the weekly (5 days) performance calculations use closing prices from Thursday, June 27th.

COMMENTARY
June ISM manufacturing PMI was lower than expected, coming in below 50 (48.5) and signaling a 3rd month of contraction.  ISM services PMI fared worse versus expectations, dropping to 48.8 and resuming the downtrend that started in January.

In terms of employment, job openings (JOLTs data) increased in May and June NFP was higher than expected.  Unfortunately, the NFP data comes with an asterisk, because even though June was higher than expected, both the actual and expected data was than May numbers, even after May numbers were revised lower!

This week starts with two speeches from Federal Reserve Chair Powell (Tuesday/Wednesday), following by CPI on Thursday, and PPI Friday.  And don’t forget that earnings season starts later this week with the banking sector.

Best to Your Week!

P.S. If you find this research helpful, please tell a friend.
If you don’t, tell an enemy.
Sources: Bloomberg, CNBC, Federal Reserve Bank of St. Louis, Hedgeye, Stockcharts.com, U.S. Bureau of Economic Analysis, U.S. Bureau of Labor Statistics

Invest Safely, LLC is an independent investment research and online financial media company.  Use of Invest Safely, LLC and any other products available through invest-safely.com is subject to our Terms of Service and Privacy Policy.
Not a recommendation to buy or sell any security.
Posted in Historical Data, Market Trends | Tagged , , , | Comments Off on Weekend Stock Market Outlook – July 07 2024

Weekend Stock Market Outlook – June 30 2024

Stock Market Outlook entering the Week of June 30th = Uptrend

  • ADX Directional Indicators: Uptrend
  • On Balance Volume Indicator: Uptrend
  • Institutional Activity (Price & Volume): Uptrend

ANALYSIS
The stock market outlook shows an uptrend in place for U.S. equities as we head into July.

The S&P500 ($SPX) dropped 0.1% last week, so the index remains ~4% above the 50-day moving average and ~12% above the 200-day moving average.

Technical analysis of daily SPX prices

SPX Price & Volume Chart for the Week of June 30 2024

All three indicators (ADX, On Balance Volume and Institutional activity) remain bullish. Friday’s reversal came with abnormally high trading volume, showing institutions were very active.

The energy sector ($XLE) outperformed last week, followed by Communications ($XLC).  All the other sectors were down, with Utilities leading the way again ($XLU).

Weekly price performance of S&P500 sector ETFs

S&P Sector Performance for Week 26 of 2024

A third week of leadership from Oil, although somewhat muted at +1.2%. The hits just keep on coming for Bitcoin, losing another 6.7%, for a 3 week drop of roughly -16%! That’s a good reminder of the volatility associated with Bitcoin, as well as crypto an asset class. Price performance resembles that of a commodity (like oil or wheat), and is why it’s still not an appropriate store of value for most investors. Gold and the dollar have been almost perfectly correlated over the past 2 weeks, each remaining essentially flat.

Weekly price performance by asset class

Asset Class Performance for Week 26 of 2024

COMMENTARY
Although the $SPX reached a new all time high on Friday morning, the rest of the session should give investors pause. A rejection of the high for the day, coupled with abnormally high trading volume, suggests aggressive selling by market participants. While end of month/quarter/half rebalancing may be the driver, keep an eye on the distribution day count for signs of more selling over the next week or two.

The final Q1 US GDP figure showed a gain of 1.4%, dropping significantly verses Q1 2023 (+2.2%).

Meanwhile, May PCE data was inline with estimates and showed a slight decline year over year.

PCE (y/y) Actual Prior
Expected
Headline +2.6% +2.7% +2.6%
Core +2.6% +2.8% +2.6%

For the week ahead, ISM releases June manufacturing PMI data on Monday.  Federal Reserve Chairman Powell speaks on Tuesday, just ahead of May JOLTs data, followed by June ISM Services PMI and FOMC minutes on Wednesday.  And finally, June NFP/ unemployment data comes out Friday morning.

Trading-wise, a short week due to Independence Day.  U.S. markets will trade for a half-session on Wednesday, close on Thursday, then resume trading on Friday for what is likely to be a low volume day.

Best to Your Week!

P.S. If you find this research helpful, please tell a friend.
If you don’t, tell an enemy.

Sources: Bloomberg, CNBC, Federal Reserve Bank of St. Louis, Hedgeye, Stockcharts.com, U.S. Bureau of Economic Analysis, U.S. Bureau of Labor Statistics

Invest Safely, LLC is an independent investment research and online financial media company.  Use of Invest Safely, LLC and any other products available through invest-safely.com is subject to our Terms of Service and Privacy Policy.
Not a recommendation to buy or sell any security.
Posted in Historical Data, Market Trends | Tagged , , , | Comments Off on Weekend Stock Market Outlook – June 30 2024

Weekend Stock Market Outlook – June 23 2024

Stock Market Outlook entering the Week of June 23rd = Uptrend

  • ADX Directional Indicators: Uptrend
  • On Balance Volume Indicator: Uptrend
  • Institutional Activity (Price & Volume): Uptrend

ANALYSIS
The stock market outlook shows an uptrend in place for U.S. equities.

The S&P500 ($SPX) rose 0.6% last week.  The index ended the week ~4% above the 50-day moving average and ~13% above the 200-day moving average.

Technical analysis of daily SPX prices

SPX Price & Volume Chart for the Week of June 23 2024

All three indicators (ADX, On Balance Volume and Institutional activity) remain bullish.

Consumer Discretionary ($XLY), led by Amazon, Tesla, and Home Depot, was the best sector last week.  Utilities ($XLU) led to the downside.

Weekly price performance of S&P500 sector ETFs

S&P Sector Performance for Week 25 of 2024

The trend in asset prices carried over for a second week in a row, with oil leading to the upside (+3.8%) and Bitcoin leading downward (-3.5%).  Those returns put their two week performance at +8% and -9.2%, respectively.

Weekly price performance by asset class

Asset Class Performance for Week 25 of 2024

COMMENTARY
May retail sales were up 2.3% versus last year; slightly lower than the 2.7% y/y increase seen in April.  Otherwise, a fairly quiet week on the macroeconomic front.

Most of the commotion occurred withing futures and options; Friday’s quarterly options expiration was the largest ever.

This week, we get the final Q1 GDP figure (Thursday) and May PCE data (Friday).

Best to Your Week!

P.S. If you find this research helpful, please tell a friend.
If you don’t, tell an enemy.

Sources: Bloomberg, CNBC, Federal Reserve Bank of St. Louis, Hedgeye, Stockcharts.com, U.S. Bureau of Economic Analysis, U.S. Bureau of Labor Statistics

Invest Safely, LLC is an independent investment research and online financial media company.  Use of Invest Safely, LLC and any other products available through invest-safely.com is subject to our Terms of Service and Privacy Policy.
Not a recommendation to buy or sell any security.
Posted in Historical Data, Market Trends | Tagged , , , | Comments Off on Weekend Stock Market Outlook – June 23 2024

Weekend Stock Market Outlook – June 16 2024

Stock Market Outlook entering the Week of June 16th = Uptrend

  • ADX Directional Indicators: Uptrend
  • On Balance Volume Indicator: Uptrend
  • Institutional Activity (Price & Volume): Uptrend

ANALYSIS
The stock market outlook shows an uptrend in place for U.S. equities.

The S&P500 ($SPX) rose 1.6% last week.  The index ended the week ~4% above the 50-day moving average and ~13% above the 200-day moving average.

Technical analysis of daily SPX prices

SPX Price & Volume Chart for the Week of June 16 2024

All three indicators (ADX, On Balance Volume and Institutional activity) remain bullish, thanks in large part to technology stocks.

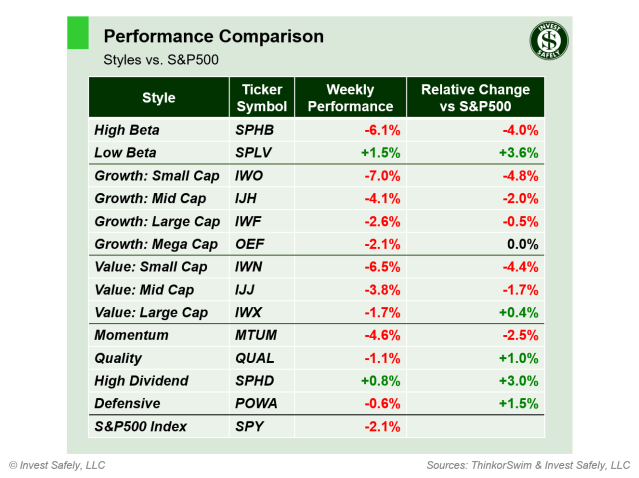
So it’s no surprise to see the Tech sector ($XLK) leading the way last week.  What is a bit of a surprise?  All of the other sectors underperforming versus the index.  That’s not a sign of a healthy market, but we have to play the cards we have, not the cards we want.

Energy ($XLE) led to the downside.  Energy sector stocks have not been kind to investors since April.  Industrials and Financials also weakening significantly over the past month.

Weekly price performance of S&P500 sector ETFs

S&P Sector Performance for Week 24 of 2024

Oil was the big winner last week, rallying 4.2% and reclaiming its 200-day moving average after a rough couple of months.  Bitcoin did not fair well, dropping 5.4% and is now looking for support from its 50-day moving average.

Weekly price performance by asset class

Asset Class Performance for Week 24 of 2024

COMMENTARY
The May Consumer Price Index (CPI) declined versus April and came in below expectations, giving stocks a boost mid-week as investors looked forward to eventual rate cuts.

CPI (y/y) Actual Prior
Expected
Headline +3.3% +3.4% +3.4%
Core +3.4% +3.6% +3.5%

The Producer Price Index also showed signs of improvement, although that was due to an upward revision in the April figures (prior Headline reading was +1.8%, prior Core reading was +2.1%).

PPI (y/y) Actual Prior
Expected
Headline +2.2% +2.3% +2.5%
Core +2.3% +2.4% +2.4%

Despite seemingly positive inflation data, the U.S. FOMC decided to keep rates unchanged, citing the need for more evidence that inflation is really in the rear-view mirror.

For the week ahead, May retail sales figures are released on Tuesday, U.S. markets are closed Wednesday (Juneteenth holiday), and Quarterly options expiration is Friday.

Best to Your Week!

P.S. If you find this research helpful, please tell a friend.
If you don’t, tell an enemy.
Sources: Bloomberg, CNBC, Federal Reserve Bank of St. Louis, Hedgeye, Stockcharts.com, U.S. Bureau of Economic Analysis, U.S. Bureau of Labor Statistics

Invest Safely, LLC is an independent investment research and online financial media company.  Use of Invest Safely, LLC and any other products available through invest-safely.com is subject to our Terms of Service and Privacy Policy.
Not a recommendation to buy or sell any security.
Posted in Historical Data, Market Trends | Tagged , , , | Comments Off on Weekend Stock Market Outlook – June 16 2024