Stock Market Outlook entering the Week of August 4th = Downtrend
- ADX Directional Indicators: Downtrend
- On Balance Volume Indicator: Downtrend
- Institutional Activity (Price & Volume): Uptrend
ANALYSIS
The stock market outlook flipped to a downtrend after U.S. equity markets encountered elevated institutional selling.
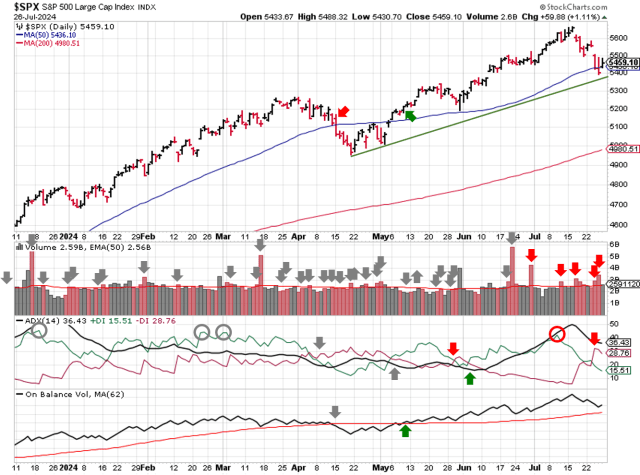
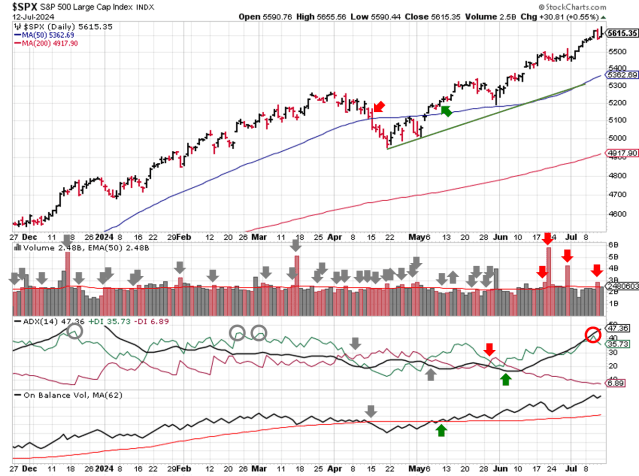
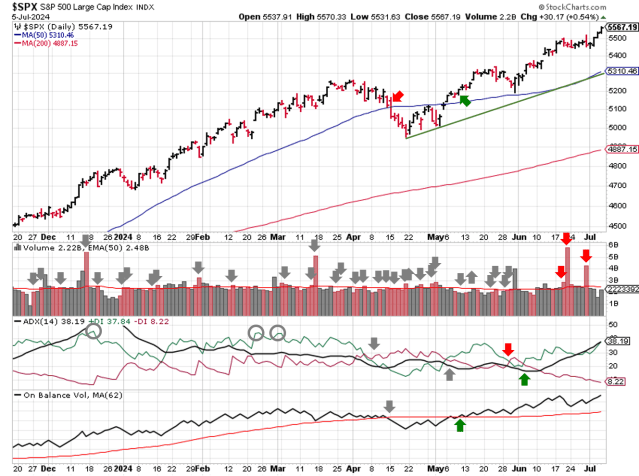
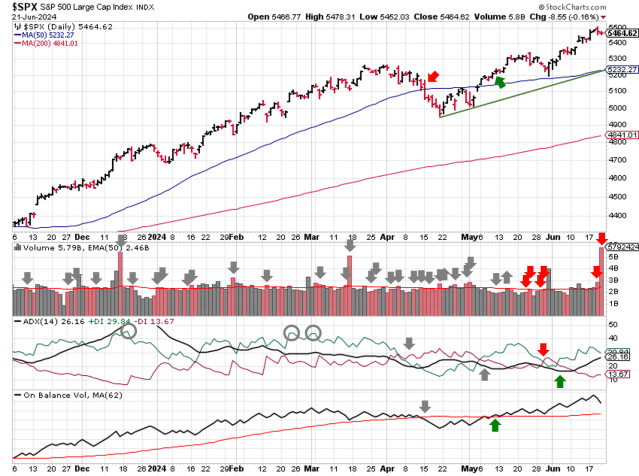
The S&P500 ($SPX) fell 2.1% last week, breaking below the 50-day moving average. The index now sits ~2% below that level, and ~7% above the 200-day moving average.

SPX Price & Volume Chart for the Week of August 04 2024
The ADX remains bearish. On Balance Volume continues to decline, but hasn’t flipped to a bearish signal yet.
Institutional activity moved to a downtrend after closing below the 50-day moving average on Friday. The total distribution days stands at 6, but like last week, down days that weren’t higher in volume were still above average (Thursday).

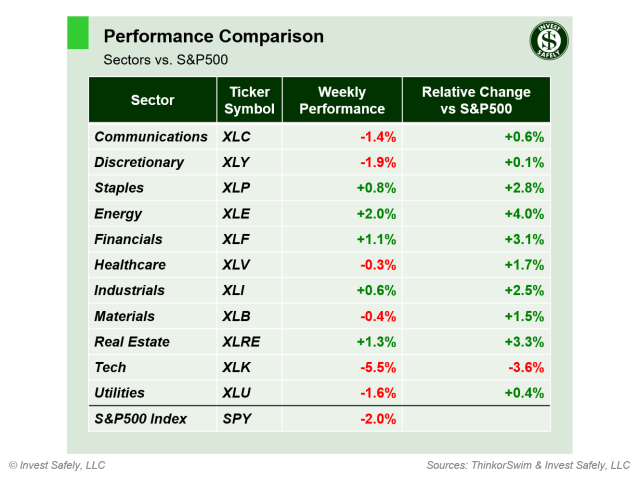
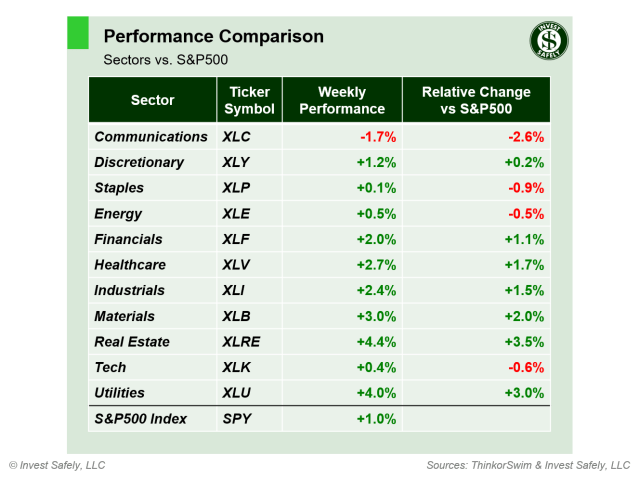
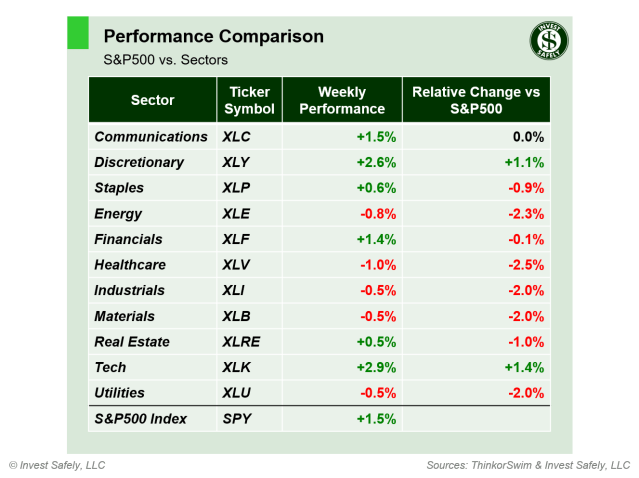
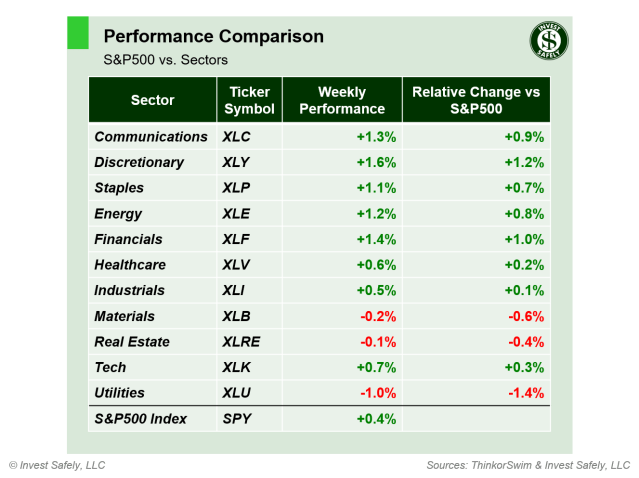
S&P Sector Performance for Week 31 of 2024
The market concentration in Mag 7 stocks continues to create a wide range of returns. Tech ($XLK) was the worst sector again, while Utilities ($XLU) and Real Estate ($XLRE) outperformed (i.e. generated “alpha”).
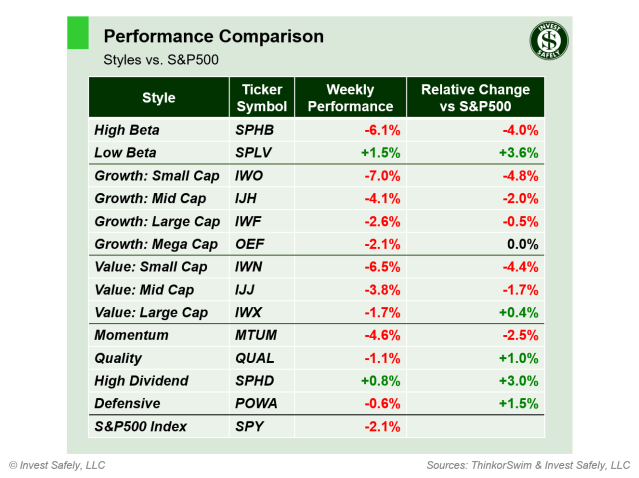
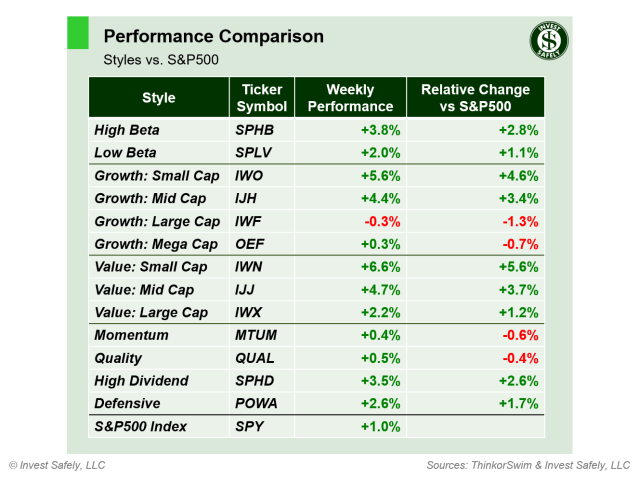
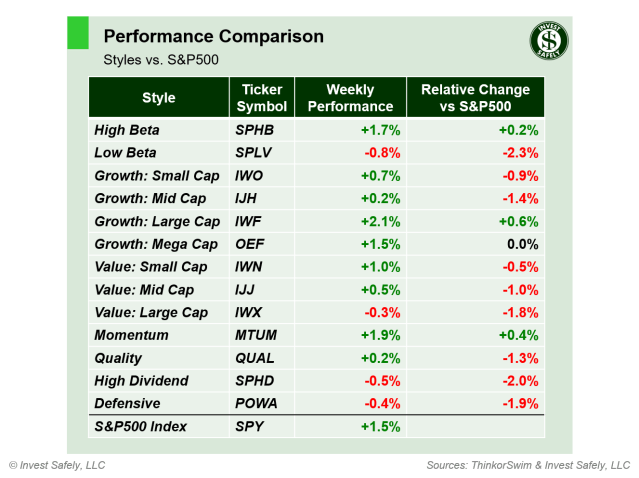
Sector Style Performance for Week 31 of 2024
From a sector style perspective, there weren’t many areas to hide from the sell-off. After several weeks at the top of the board, small cap styles were hammered, dropping almost 3 times as much as the general market. Low beta (i.e. low historical volatility) did the best, followed by stocks with high dividends.
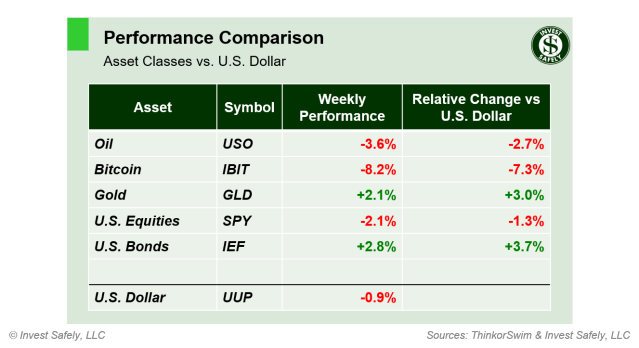
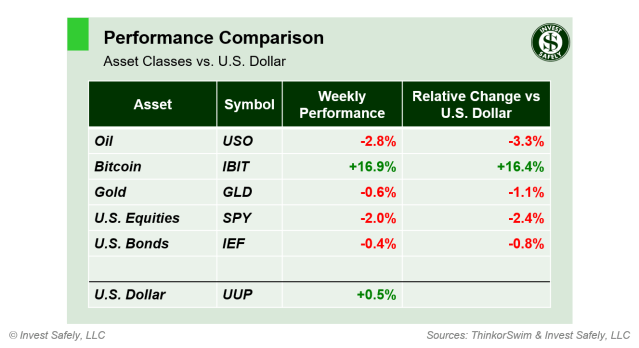
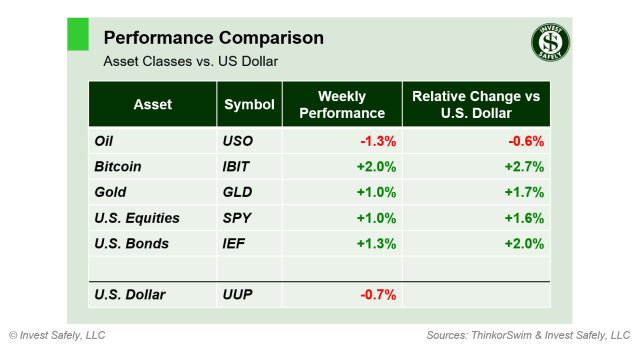
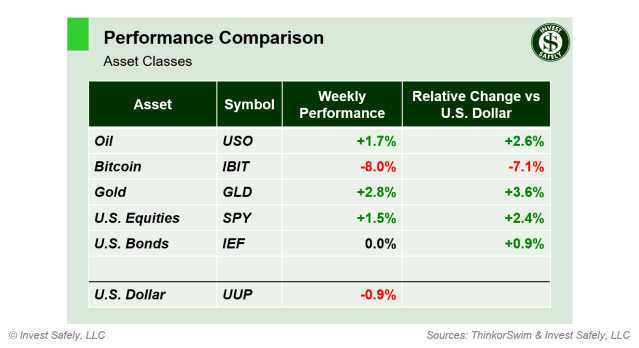
Asset Class Performance for Week 31 2024
Bitcoin led to the downside this week by at least 2 to 1, while defensive plays in bonds and gold were winners.
COMMENTARY
Apple, Meta, and Microsoft reported better than expected earnings and guidance for next quarter, while Amazon disappointed on both fronts. Nvidia ($NVDA) is the last of the Mag 7 to report; their earnings aren’t released until August 28th.
On the macroeconomic front, JOLTS fell slightly from last month, but was above expectations, so market participants didn’t react much to the news. The ISM Manufacturing PMI survey came in at 46.6 in July, dropping from 48.5 in June and showing US manufacturing activity remains in a contraction.

ISM Manufacturing PMI
Source: TradingEconomics.com
The FOMC left rates unchanged. Essentially, they see the fight against inflation nearing an end, and the labor market beginning to cool so it’s time to start thinking about rate cuts (remember the Powell Pivot back in May). And right on cue, NFP delivered supporting evidence.
Non-farm payrolls (NFP) missed bigly. The U.S. economy added 114K jobs in July, far below for 175K. June’s numbers got a negative revision, dropping from 206k to 179k, so there’s some risk that July’s “miss” will be even worse than first reported.
The bond market isn’t waiting around for the FOMC to make up their mind though. The yield on a 3-month treasury dropped 13 basis points last week, basically half of a rate cut (0.25% rate cut = 25 basis points). The 2-year dropped almost 0.5%.

Source: Stockcharts.com
The moves in rates allowed the 10-year vs. 2-year Treasury yield to briefly un-invert during Friday’s session; the first time that’s happened since July 2022. The move suggests the yield curve is nearing the end of the deepest inversion since the early 1980’s.
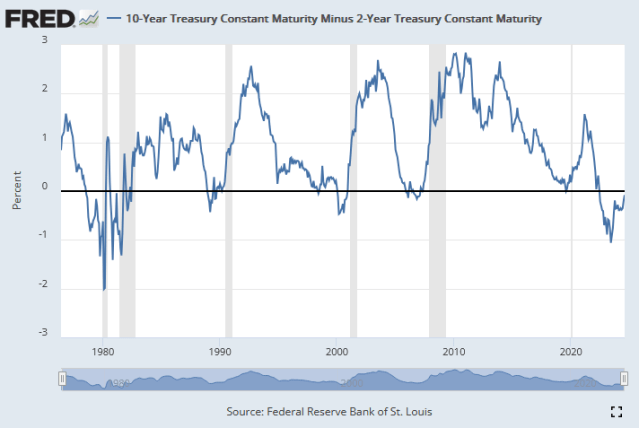
Typically, a recession occurs 12-24 months after an inversion. Since we’re in month 25 of the most recent inversion, some pundits question whether the signal still works or if it’s different this time, etc. Even Powell made a passing comment during the his post-FOMC speech.
But that’s the thing with leading indicators…they’re early. And by constantly referring to “long and variable lags”, the Powell himself has acknowledged expectations for a longer cycle this time around. But not to worry: “Sahm rule” has entered the chat, giving people a much shorter-term signal related to employment.
[The] Sahm Recession Indicator signals the start of a recession when the three-month moving average of the national unemployment rate (U3) rises by 0.50 percentage points or more, relative to its low during the previous 12 months.

As you can see, the indicator hit 0.53 in July, indicating a recession started in July.
Remember, we can’t predict, but we can prepare. Recessions are only identified in hindsight, after data revisions and adjustments to quarterly GDP, by the “official” recession scorekeepers: The National Bureau of Economic Research (NBER) Business Cycle Dating Committee. Suffice to say that’s one reason most recessions are over by the time they’re “official”.
With a downtrend now confirmed, check your holdings and correct any mistakes or “undisciplined” trades that occurred during the uptrend: cut losing positions, add stops to reduce potential losses, reduce risk by lowering position sizes of volatile (i.e. high beta) positions, and/or take profits.
Volatility is elevated (e.g. $VIX > 20), which changes capital flows and creates a different kind of trading environment. Buyers and sellers will pressure the market, so don’t be surprised by back and forth price action. The S&P500 could easily rally and retest the 50-day moving average, sell-off to the 200-day, or something in between. Your job now is to ensure winning trades don’t turn into losing trades.
Best to Your Week!
P.S. If you find this research helpful, please tell a friend.
If you don’t, tell an enemy.