Weekend Stock Market Outlook – August 25 2024

Stock Market Outlook entering the Week of August 25th = Uptrend

  • ADX Directional Indicators: Uptrend
  • On Balance Volume Indicator: Uptrend
  • Institutional Activity (Price & Volume): Uptrend

ANALYSIS
The stock market outlook shows an uptrend in place, with equities looking to close out August at all time highs.

The S&P500 ($SPX) rose 1.4% last week.  The index sits ~3% above the 50-day moving average and ~11% above the 200-day moving average.

Technical analysis of daily SPX prices

SPX Price & Volume Chart for the Week of August 25 2024

All three signals show bullish action.  Index volume remains below average, which is expected during sessions at the end of August.  Traders and their volume should return to their desks after Labor Day.

Weekly price performance of S&P500 sector ETFs


S&P Sector Performance for Week 34 of 2024

Real Estate ($XLRE) led the way last week, although most sectors advanced for the week.  Energy sector ($XLE) was the lone holdout and worst performer, largely due to oil’s underperformance and correlation to the U.S. dollar (more below).

Weekly price performance by sector style

Sector Style Performance for Week 34 of 2024

All sector styles had positive returns last week: Small Caps (growth & value) led the way, while large and mega cap growth underperformed the general market.

Weekly price performance by asset class

Asset Class Performance for Week 34 2024

Asset classes benefited from continued weakness in the U.S. dollar.  Bitcoin let assets higher, while Oil underperformed.  Over the past 3 weeks, moves in oil and the dollar are highly correlated, while dollar correlations with the other assets classes are negative.

COMMENTARY
A rather large, negative revision to non-farm payrolls hit the wires midweek, suggesting the labor market hasn’t been as robust as experts believed.  Given employment is now the focus of the FOMC (rather than inflation), it’s no surprise that Federal Reserve Chairman Powell said the time has come to cut interest rates during his Friday speech.

Markets rejoiced.  Media outlets were quick to highlight the coming change, saying that inflation is no longer an issue (wrong), and consumers will find relief in the form of lower payments on debt (new mortgages, credit card balances, etc.).  Probably a bridge too far, and a dangerous one at that, but you know what they say: “Never let the truth ruin a good story”.

Next week, all eyes are on Nvidia; they release quarterly earnings Wednesday after market close.  The data will serve as a catalyst for market moves, given $NVDA’s importance to the artificial intelligence narrative and semi-conductor supply chain, as well as the stocks relative high index weighting.  They’ve blown past targets the past few quarters.  Lets hope market participants are equally impressed this time around, or it could be a rough start to September.

The market also gets July Durable Goods data on Monday, the 2nd Q2 GDP estimate on Thursday, and July PCE on Friday.

Best to Your Week!

P.S. If you find this research helpful, please tell a friend.
If you don’t, tell an enemy.

Sources: Bloomberg, CNBC, Federal Reserve Bank of St. Louis, Hedgeye, Stockcharts.com, TradingEconomics.com, U.S. Bureau of Economic Analysis, U.S. Bureau of Labor Statistics

Invest Safely, LLC is an independent investment research and online financial media company.  Use of Invest Safely, LLC and any other products available through invest-safely.com is subject to our Terms of Service and Privacy Policy.
Not a recommendation to buy or sell any security.
Posted in Historical Data, Market Trends | Tagged , , , | Comments Off on Weekend Stock Market Outlook – August 25 2024

Weekend Stock Market Outlook – August 18 2024

Stock Market Outlook entering the Week of August 18th = Uptrend

  • ADX Directional Indicators: Uptrend
  • On Balance Volume Indicator: Uptrend
  • Institutional Activity (Price & Volume): Uptrend

ANALYSIS
The stock market outlook returned to an uptrend last Tuesday, after a very brief correction.

The S&P500 ($SPX) rose 3.9% last week.  The index sits ~2% above the 50-day moving average and ~10% above the 200-day moving average.

Technical analysis of daily SPX prices

SPX Price & Volume Chart for the Week of August 18 2024

All three signals show bullish action.  On Balance Volume was the first mover, going green on Monday.  After putting in a potential rally start on August 6th, institutional activity confirmed the move on Tuesday with a follow-through day.  That flipped the signal and the outlook to an uptrend.  The ADX confirmed the bullish move on Friday.

Weekly price performance of S&P500 sector ETFs

S&P Sector Performance for Week 33 of 2024

The Technology sector ($XLK) led the way last week, rising almost 8%!   Real estate was the laggard ($XLRE), barely getting past break-even.  The saying “a rising tide lifts all boats” applied last week, as the heavy hitters responsible for most of the movement in the overall index and outperformance was limited to just 2 sectors.

Weekly price performance by sector style

Sector Style Performance for Week 33 of 2024

From a sector style perspective, Momentum, Large Cap, and High Beta tickers gained 5% or more, while high dividend and low beta tickers underperformed the general market.

Weekly price performance by asset class

Asset Class Performance for Week 33 2024

Gold led assets higher last week, benefiting from the weaker dollar, while Bitcoin led to the downside.

COMMENTARY
The volatility party ended as quickly as it started, with equities regaining most of their August sell-off and the $VIX back below 15.  Just two weeks ago, the volatility index spiked to 65 and financial pundits were calling for emergency rate cuts.  Seems like a year ago already; market time is a lot like dog-years in that sense.

July’s retail sales data came in better than expected at +2.7% y/y, thanks in part to automotive sales. And as expected, July Producer and Consumer price indexes showed further slowing of inflation, reflecting the lower levels experienced last summer.  The consumer price index (CPI) fell for the fourth month in a row, down to 2.9% y/y in July, from 3.0% y/y in June.

CPI (y/y) Actual Prior
Expected
Headline +2.9% +3.0% +3.0%
Core +3.2% +3.3% +3.2%

Producer prices (PPI) fell to 2.2% y/y in July, from June’s 2.7% y/y reading

PPI (y/y) Actual Prior
Expected
Headline +2.2% +2.7%* +2.3%
Core +2.4% +3.0% +2.7%

August readings should benefit from the lower comparisons as well, but September through December will be more challenging.

This week is the Federal Reserve’s annual Jackson Hole symposium, with remarks from Chairman Powell scheduled for Friday morning.  Otherwise, a fairly quiet week for macroeconomic data.

With the market outlook back in uptrend territory, capital flows should support higher prices.  It’s not the time to get complacent though, as we were in almost the exact same position last August.  Equity markets corrected to start the month, only to reverse higher heading into September.  But that was the first of two head-fakes.  Equities sold off again until early October, then rallied back to the 50-day moving average, only to head lower again…right up until the U.S. Treasury adjusted the bond allocations used for the Quarterly Refunding Announcement (QRA) and provided a rally catalyst.

Best to Your Week!

P.S. If you find this research helpful, please tell a friend.
If you don’t, tell an enemy.

Sources: Bloomberg, CNBC, Federal Reserve Bank of St. Louis, Hedgeye, Stockcharts.com, TradingEconomics.com, U.S. Bureau of Economic Analysis, U.S. Bureau of Labor Statistics

Invest Safely, LLC is an independent investment research and online financial media company.  Use of Invest Safely, LLC and any other products available through invest-safely.com is subject to our Terms of Service and Privacy Policy.
Not a recommendation to buy or sell any security.
Posted in Historical Data, Market Trends | Tagged , , , | Comments Off on Weekend Stock Market Outlook – August 18 2024

Weekend Stock Market Outlook – August 11 2024

Stock Market Outlook entering the Week of August 11th = Downtrend

  • ADX Directional Indicators: Downtrend
  • On Balance Volume Indicator: Downtrend
  • Institutional Activity (Price & Volume): Mixed

ANALYSIS
The stock market outlook enters the second week of a downtrend after an extremely volatile week for global equity traders.

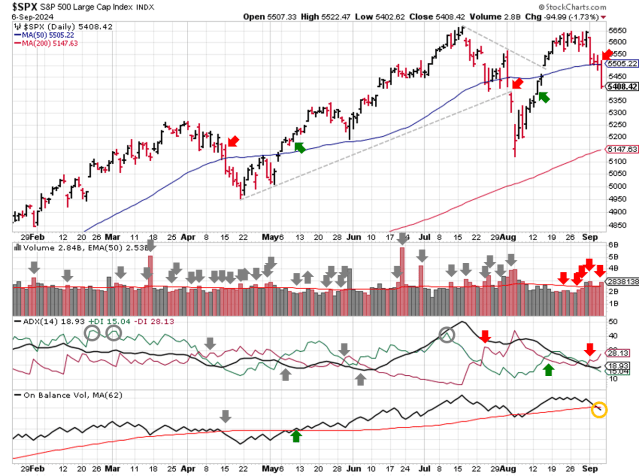
Despite all the price movement, the S&P500 ($SPX) was flat for the week.  The index sits ~2% below the 50-day moving average and ~6% above the 200-day moving average.

Technical analysis of daily SPX prices

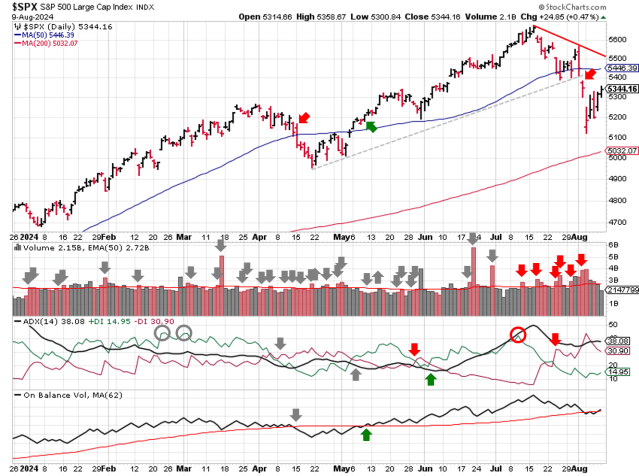
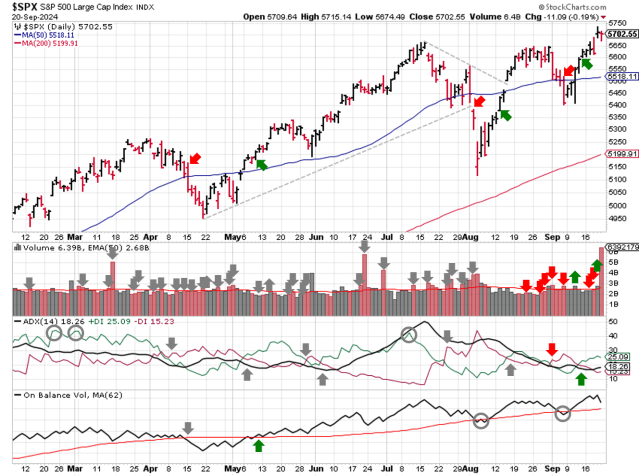
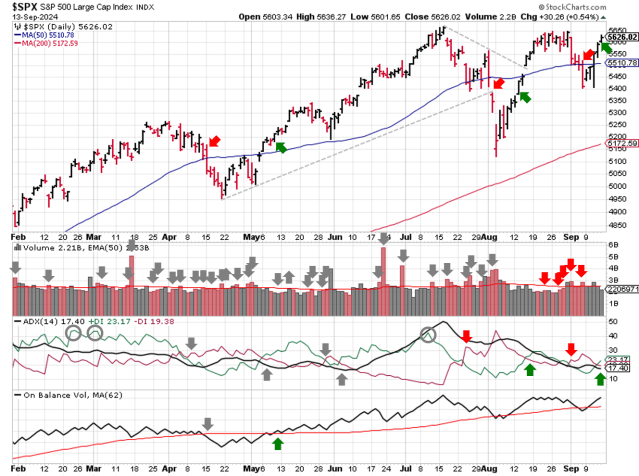
SPX Price & Volume Chart for the Week of August 11 2024

The ADX and institutional activity remain bearish.  On Balance Volume shifts to mixed as it oscillates around its moving average.

Weekly price performance of S&P500 sector ETFs

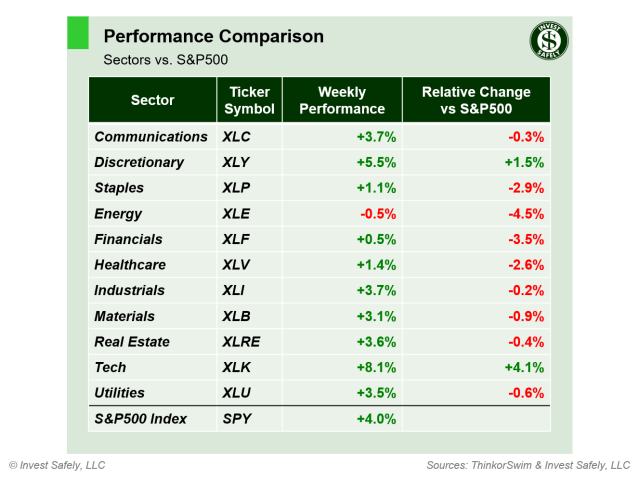
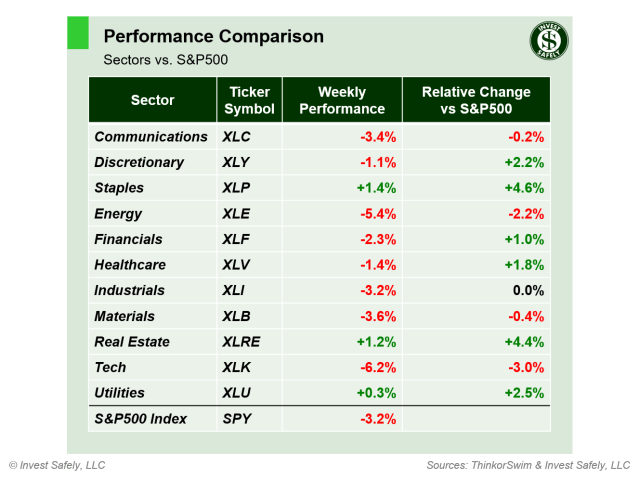
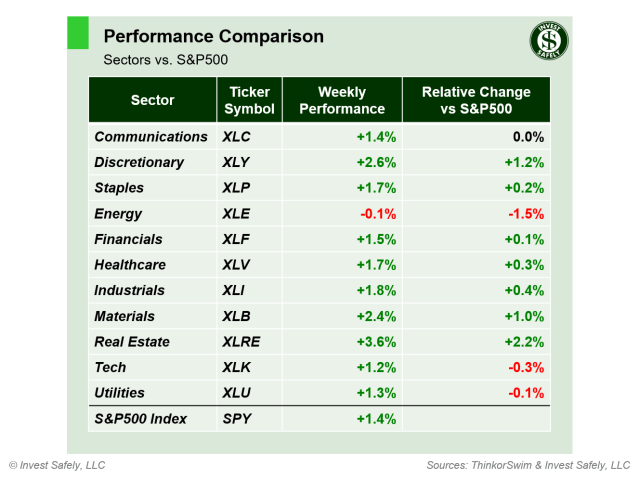
S&P Sector Performance for Week 32 of 2024

Sector-wise, Industrials were the best performer last week ($XLI), while Materials ($XLB) led to the downside (an odd pairing for best/worst sectors).

Weekly price performance by sector style

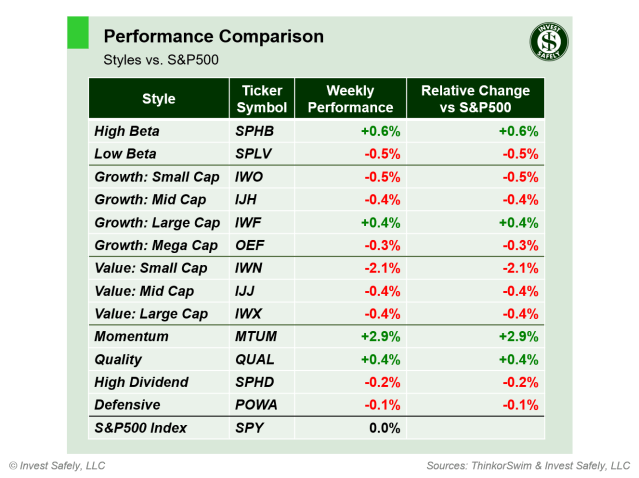
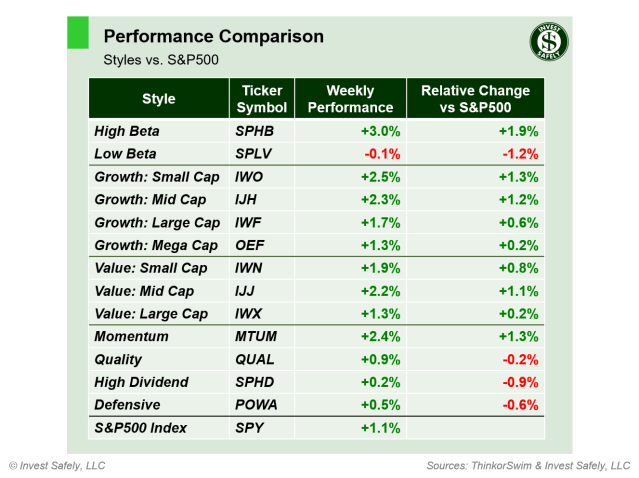
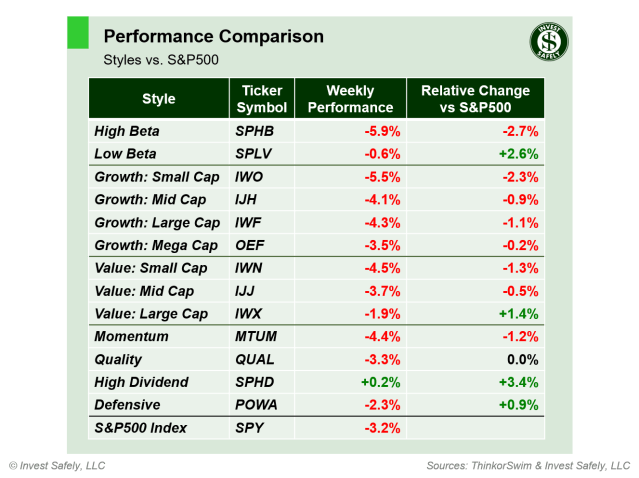
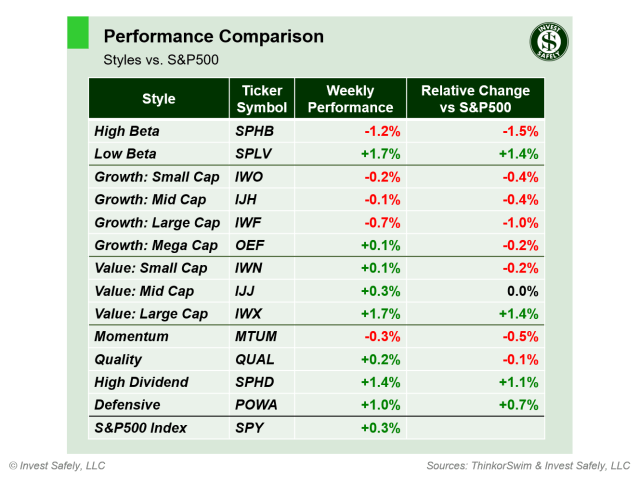
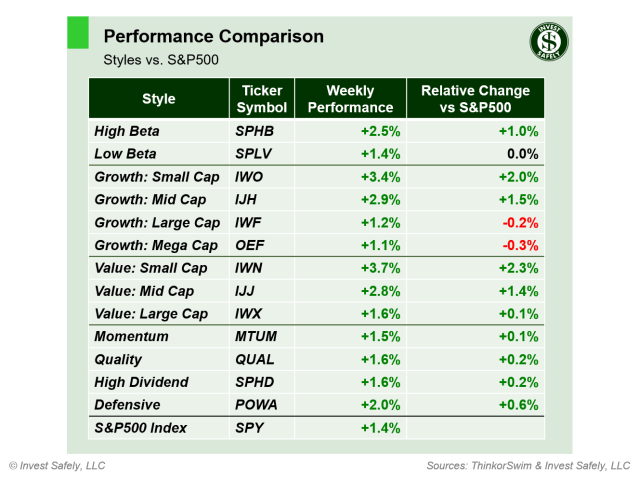
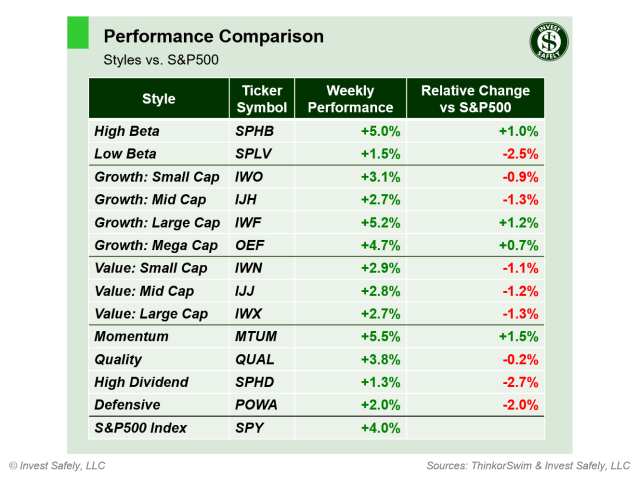
Sector Style Performance for Week 32 of 2024

From a sector style perspective, Momentum was the best, while Small Cap Value was the worst.  Both were at extremes (oversold/overbought, respectively), so the reversions aren’t too surprising.

Weekly price performance by asset class

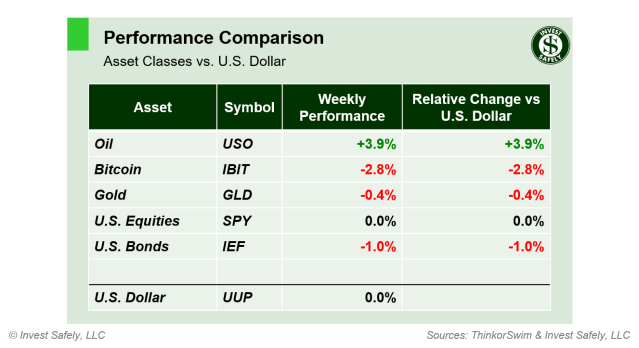
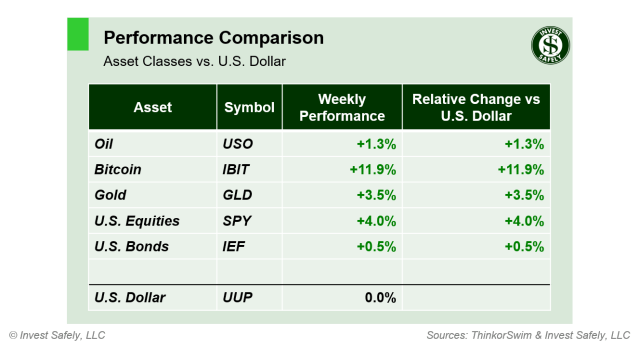
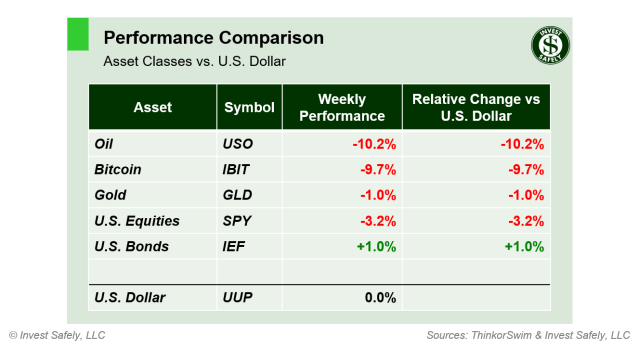
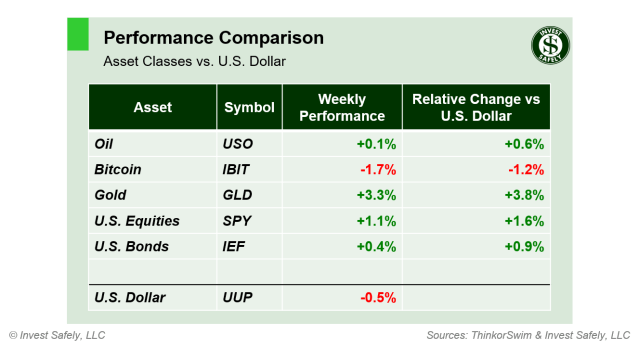
Asset Class Performance for Week 32 2024

Bitcoin led to the downside again last week, but by a much smaller margin than last time. Oil led the way higher.

COMMENTARY
Last post, the Sahm rule and recession fears that were top of mind for financial media.  Last week, it was the Yen-Carry trade crashing global markets, and the need for the U.S. Fed to provide emergency rate cuts.

The Bank of Japan announced a rate hike, which caught market participants off guard and sent the Nikkei index down more than 12% in one day.  Japanese stocks recovered a majority of those losses in the following session.

Policy surprises of any kind tend to generate volatility, which is why the Fed has started putting the word out months ahead of any policy change (remember when the FOMC was thinking about “thinking about” rate hikes a few years ago?).

The resulting equity market volatility stoked fears that the long-awaited unwind of the Yen-carry trade was in progress.  We discussed the Yen carry trade back in March when the first hike was announced.

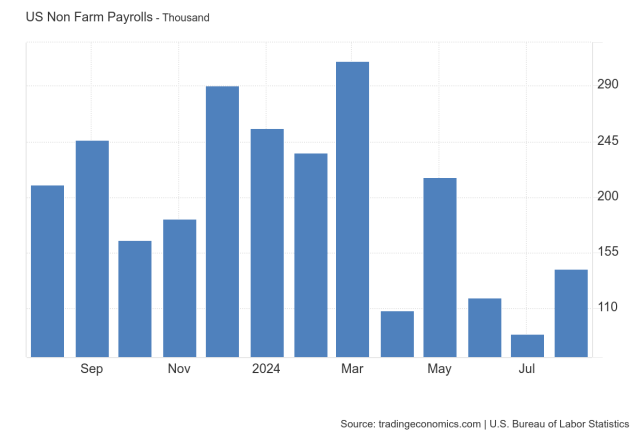
In the States, some pundits initially attributed the U.S. sell-off to the lower than expected jobs data, released the prior Friday.  The knee-jerk reaction was a call for emergency rate cuts to stave off the further weakening of the stock market…I mean the economy…I mean price stability and labor markets<wink>.

It doesn’t matter that the same outlets were dismissing the idea of any economic or labor weakness when the GDP  figures were released two weeks ago.  Newsflash: the Fed isn’t supposed to prop up equity markets (whether they do from time to time, in coordination with the Treasury, is another discussion entirely).

As equity markets recovered, financial media softened their call for immediate rate cuts.  The creator of the Sahm rule was trotted out on several networks to cool recession fears, stating that this time really is different because immigration, specifically unemployed immigrants, is skewing the number higher.

By the end of the week, the narrative had settled on knee-jerk reactions to the surprise jobs data and BOJ rate hike.  Maybe they all realized that an emergency rate cut would create even more pressure to unwind the yen-carry trade, not to mention signaling a lack of confidence in the current market environment, both of which could provide another downside catalyst.  Or maybe too much money was allocated to low volatility trading strategies and got caught offsides…

Regardless of the narrative, volatility returned in a BIG way last week, with the SPX volatility index ($VIX) reaching the mid-60’s on Monday.  As a reminder, a reading above 30 is considered an extremely difficult time to hold equities due to big, fast price swings. It’s also when equities tend to underperform other asset classes.

Sure enough, recent asset class and sector price movement also align with a weaker environment for equities, with leadership in bonds/gold & REITs/Utilities indicating a deflationary environment in place (when measuring their relative performance over the past 4 weeks).

More volatility could be in the cards this week, with the release of the latest inflation data (PPI & CPI).  The year over year comparisons aren’t particularly high, so we should see inflation flat or slowing, bolstering the calls for rate cuts in September.

Best to Your Week!

P.S. If you find this research helpful, please tell a friend.
If you don’t, tell an enemy.

Sources: Bloomberg, CNBC, Federal Reserve Bank of St. Louis, Hedgeye, Stockcharts.com, TradingEconomics.com, U.S. Bureau of Economic Analysis, U.S. Bureau of Labor Statistics

Invest Safely, LLC is an independent investment research and online financial media company.  Use of Invest Safely, LLC and any other products available through invest-safely.com is subject to our Terms of Service and Privacy Policy.
Not a recommendation to buy or sell any security.
Posted in Historical Data, Market Trends | Tagged , , , | Comments Off on Weekend Stock Market Outlook – August 11 2024

Weekend Stock Market Outlook – August 04 2024

Stock Market Outlook entering the Week of August 4th = Downtrend

  • ADX Directional Indicators: Downtrend
  • On Balance Volume Indicator: Downtrend
  • Institutional Activity (Price & Volume): Uptrend

ANALYSIS
The stock market outlook flipped to a downtrend after U.S. equity markets encountered elevated institutional selling.

The S&P500 ($SPX) fell 2.1% last week, breaking below the 50-day moving average.   The index now sits ~2% below that level, and ~7% above the 200-day moving average.

Technical analysis of daily SPX prices

SPX Price & Volume Chart for the Week of August 04 2024

The ADX remains bearish. On Balance Volume continues to decline, but hasn’t flipped to a bearish signal yet.

Institutional activity moved to a downtrend after closing below the 50-day moving average on Friday.  The total distribution days stands at 6, but like last week, down days that weren’t higher in volume were still above average (Thursday).

Weekly price performance of S&P500 sector ETFs

S&P Sector Performance for Week 31 of 2024

The market concentration in Mag 7 stocks continues to create a wide range of returns.  Tech ($XLK) was the worst sector again, while Utilities ($XLU) and Real Estate ($XLRE) outperformed (i.e. generated “alpha”).

Weekly price performance by sector style

Sector Style Performance for Week 31 of 2024

From a sector style perspective, there weren’t many areas to hide from the sell-off.  After several weeks at the top of the board, small cap styles were hammered, dropping almost 3 times as much as the general market.  Low beta (i.e. low historical volatility) did the best, followed by stocks with high dividends.

Weekly price performance by asset class

Asset Class Performance for Week 31 2024

Bitcoin led to the downside this week by at least 2 to 1, while defensive plays in bonds and gold were winners.

COMMENTARY
Apple, Meta, and Microsoft reported better than expected earnings and guidance for next quarter, while Amazon disappointed on both fronts. Nvidia ($NVDA) is the last of the Mag 7 to report; their earnings aren’t released until August 28th.

On the macroeconomic front, JOLTS fell slightly from last month, but was above expectations, so market participants didn’t react much to the news. The ISM Manufacturing PMI survey came in at 46.6 in July, dropping from 48.5 in June and showing US manufacturing activity remains in a contraction.

Highlight contraction in ISM Manufacturing Survey data

ISM Manufacturing PMI
Source: TradingEconomics.com

The FOMC left rates unchanged. Essentially, they see the fight against inflation nearing an end, and the labor market beginning to cool so it’s time to start thinking about rate cuts (remember the Powell Pivot back in May). And right on cue, NFP delivered supporting evidence.

Non-farm payrolls (NFP) missed bigly. The U.S. economy added 114K jobs in July, far below for 175K. June’s numbers got a negative revision, dropping from 206k to 179k, so there’s some risk that July’s “miss” will be even worse than first reported.

The bond market isn’t waiting around for the FOMC to make up their mind though.  The yield on a 3-month treasury dropped 13 basis points last week, basically half of a rate cut (0.25% rate cut = 25 basis points).  The 2-year dropped almost 0.5%.

Highlight drop in US Treasury yields as a result of weak NFP data

Source: Stockcharts.com

The moves in rates allowed the 10-year vs. 2-year Treasury yield to briefly un-invert during Friday’s session; the first time that’s happened since July 2022.  The move suggests the yield curve is nearing the end of the deepest inversion since the early 1980’s.

Highlight Yield Curve Un-inversion (2s and 10s) and recessions

Typically, a recession occurs 12-24 months after an inversion.  Since we’re in month 25 of the most recent inversion, some pundits question whether the signal still works or if it’s different this time, etc.  Even Powell made a passing comment during the his post-FOMC speech.

But that’s the thing with leading indicators…they’re early.  And by constantly referring to “long and variable lags”, the Powell himself has acknowledged expectations for a longer cycle this time around.  But not to worry:  “Sahm rule” has entered the chat, giving people a much shorter-term signal related to employment.

[The] Sahm Recession Indicator signals the start of a recession when the three-month moving average of the national unemployment rate (U3) rises by 0.50 percentage points or more, relative to its low during the previous 12 months.

Highlight alignment of Sahm Rule and Recessions

As you can see, the indicator hit 0.53 in July, indicating a recession started in July.

Remember, we can’t predict, but we can prepare.  Recessions are only identified in hindsight, after data revisions and adjustments to quarterly GDP, by the “official” recession scorekeepers: The National Bureau of Economic Research (NBER) Business Cycle Dating Committee.  Suffice to say that’s one reason most recessions are over by the time they’re “official”.

With a downtrend now confirmed, check your holdings and correct any mistakes or “undisciplined” trades that occurred during the uptrend: cut losing positions, add stops to reduce potential losses, reduce risk by lowering position sizes of volatile (i.e. high beta) positions, and/or take profits.

Volatility is elevated (e.g. $VIX > 20), which changes capital flows and creates a different kind of trading environment.  Buyers and sellers will pressure the market, so don’t be surprised by back and forth price action.  The S&P500 could easily rally and retest the 50-day moving average, sell-off to the 200-day, or something in between. Your job now is to ensure winning trades don’t turn into losing trades. 

Best to Your Week!

P.S. If you find this research helpful, please tell a friend.
If you don’t, tell an enemy.

Sources: Bloomberg, CNBC, Federal Reserve Bank of St. Louis, Hedgeye, Stockcharts.com, TradingEconomics.com, U.S. Bureau of Economic Analysis, U.S. Bureau of Labor Statistics

Invest Safely, LLC is an independent investment research and online financial media company.  Use of Invest Safely, LLC and any other products available through invest-safely.com is subject to our Terms of Service and Privacy Policy.
Not a recommendation to buy or sell any security.
Posted in Historical Data, Market Trends | Tagged , , , | Comments Off on Weekend Stock Market Outlook – August 04 2024

Weekend Stock Market Outlook – July 28 2024

Stock Market Outlook entering the Week of July 28th = Uptrend

  • ADX Directional Indicators: Downtrend
  • On Balance Volume Indicator: Mixed
  • Institutional Activity (Price & Volume): Uptrend

ANALYSIS
The stock market outlook still shows an uptrend, though the mix of signals foreshadows a change in direction if the rotation out of mega-cap stocks continues.

The S&P500 ($SPX) lost 0.8% last week.  The index now sits ~0.5% above the 50-day moving average and ~9.5% above the 200-day moving average.  Buyers didn’t defend the 5500 level, through support did emerge near 5400.

Technical analysis of daily SPX prices

SPX Price & Volume Chart for the Week of July 28 2024

The ADX shifts to a downtrend, reflecting the downward price action. On balance volume shows selling pressure as well, but remains bullish for now.

Institutional activity moves to mixed; 5 distribution days isn’t extreme, but higher than average trading volume on most down days adds to the bearish case.  Buyers stepped in on Friday, but volume was lower relative the selling on Wednesday and Thursday.

Weekly price performance of S&P500 sector ETFs

S&P Sector Performance for Week 30 of 2024

Last week’s decline was limited to just a few sectors, again showing the impact of market concentration in the Mag 7 stocks.  Tech was the worst sector ($XLK), while healthcare ($XLV) and materials ($XLB) led the way higher, just edging out financials ($XLF) and industrials ($XLI).

Weekly price performance by sector style

Sector Style Performance for Week 30 of 2024

Small caps led all sector styles…again.  Large cap and momentum styles underperformed…again.  The rotation out of Mag 7 names continued last week, as evidenced by the sector performance mentioned above.

Weekly price performance by asset class

Asset Class Performance for Week 30 2024

Bitcoin led to the upside, but nowhere near the double digit gain registered during the week of July 15th.  Oil, which read through to commodities in general, declined the most.

COMMENTARY
As noted above, the last week’s losses weren’t evenly distributed, thanks to the market-weighting of Mag 7 stocks.  The April low near 5000 was the last major support level for the S&P500, which also happens to be where the 200-day moving average is currently located.  Just a reminder that there’s another 10% downside possible before we know if this is a garden variety correction or something more.

Look for more volatility this week, with another 4 of the Magnificent 7 releasing their latest quarterly earnings ($AAPL, $AMZN, $META, $MSFT).

Durable Goods orders cratered in June, falling 6.6%.  A drop in orders for transportation equipment (automotive and aerospace) was the main culprit.

The first Q2 GDP estimate showed the economy expanded at an annualized pace of 2.8%, much higher than the final 1.4% figure in Q1.  Most concerning is the increase in government spending at 3.1%, rising from 1.8%.

June PCE data showed a small increased month over month, but the yearly figures show inflation remains sticky.  The Fed Fund futures market continues to predict rate cuts are eminent, which will be put to the test by the FOMC interest rate decision on Wednesday.

PCE (y/y) Actual Prior
Expected
Headline +2.5% +2.6% +2.5%
Core +2.6% +2.6% +2.5%

Additional economic data due this week includes June JOLTs data on Tuesday, ISM Manufacturing PMI on Thursday, and July NFP on Friday.

Best to Your Week!

P.S. If you find this research helpful, please tell a friend.
If you don’t, tell an enemy.

Sources: Bloomberg, CNBC, Federal Reserve Bank of St. Louis, Hedgeye, Stockcharts.com, U.S. Bureau of Economic Analysis, U.S. Bureau of Labor Statistics

Invest Safely, LLC is an independent investment research and online financial media company.  Use of Invest Safely, LLC and any other products available through invest-safely.com is subject to our Terms of Service and Privacy Policy.
Not a recommendation to buy or sell any security.
Posted in Historical Data, Market Trends | Tagged , , , | Comments Off on Weekend Stock Market Outlook – July 28 2024

Weekend Stock Market Outlook – July 21 2024

Stock Market Outlook entering the Week of July 21st = Uptrend

  • ADX Directional Indicators: Mixed
  • On Balance Volume Indicator: Uptrend
  • Institutional Activity (Price & Volume): Uptrend

ANALYSIS
The stock market outlook shows an uptrend in place for U.S. equities, despite the sell-off in big tech.

The S&P500 ($SPX) fell 2% last week.  The index now sits ~2% above the 50-day moving average and ~11% above the 200-day moving average. Nevertheless, the index remains historically extended from the 200-day, so further downside can’t be ruled out.  5500 is an important accumulation level from late June, so keep an eye of price behavior next week to see if buyers step in.

Technical analysis of daily SPX prices

SPX Price & Volume Chart for the Week of July 21 2024

The ADX shifts to mixed, reflecting the downward price action.  Institutional activity was also negative, although not enough to change the signal.  Thursday and Friday’s session aren’t considered distribution days due to declining trading volumes, but they still indicate higher than average selling pressure.

Weekly price performance of S&P500 sector ETFs

S&P Sector Performance for Week 29 of 2024

Digging into last week’s decline shows a wide range of performance.  Tech was the worst sector ($XLK) by far, largely due to negative headlines concerning the semiconductor industry.  Energy was the best sector ($XLE), which was a surprise given oil’s performance (see below), followed closely by real estate ($XLRE) and financials ($XLF).

Weekly price performance by sector style

Sector Style Performance for Week 29 of 2024

Small caps continued their rally, leading all sector styles.  Large cap and momentum styles underperformed, largely due to their weighting toward technology and semiconductor companies.

Weekly price performance by asset class

Asset Class Performance for Week 29 2024

And from an asset class view, Bitcoin led the way again, climbing ~17% and reminding everyone why it’s still a risk asset and not a store of value yet.  Oil was the worst asset class, dropping almost 3%.

COMMENTARY
Earnings season is in full swing, which 2 of the Mag 7 set to report this week: Tesla and Alphabet ($TSLA / $GOOGL).

No major economic news last week; June retail sales fell slightly in June (2.3% vs. 2.6% y/y), and weekly data showed a small increase in jobless claims.  This week we’ll get Durable Goods orders and the first Q2 GDP estimate Thursday morning, followed by the all important June PCE data Friday morning.

Best to Your Week!

P.S. If you find this research helpful, please tell a friend.
If you don’t, tell an enemy.

Sources: Bloomberg, CNBC, Federal Reserve Bank of St. Louis, Hedgeye, Stockcharts.com, U.S. Bureau of Economic Analysis, U.S. Bureau of Labor Statistics

Invest Safely, LLC is an independent investment research and online financial media company.  Use of Invest Safely, LLC and any other products available through invest-safely.com is subject to our Terms of Service and Privacy Policy.
Not a recommendation to buy or sell any security.
Posted in Historical Data, Market Trends | Tagged , , , | Comments Off on Weekend Stock Market Outlook – July 21 2024

Weekend Stock Market Outlook – July 14 2024

Stock Market Outlook entering the Week of July 14th = Uptrend

  • ADX Directional Indicators: Uptrend
  • On Balance Volume Indicator: Uptrend
  • Institutional Activity (Price & Volume): Uptrend

ANALYSIS
The stock market outlook shows an uptrend in place for U.S. equities, as the index nears historical extremes verses a well known technical indicator.

The S&P500 ($SPX) rallied 0.9% last week.  The index now sits ~5% above the 50-day moving average and ~14% above the 200-day moving average.

Technical analysis of daily SPX prices

SPX Price & Volume Chart – July 14 2024

All three indicators (ADX, On Balance Volume and Institutional activity) remain bullish.  That said, remember the SPX doesn’t spend much time this far above the 200-day.  We last noted the 14% level in the March 24th weekend update, just prior to the April correction.

Technical analysis of daily SPX prices

Last week’s advance saw the return of market breadth, with recent winners (e.g. $XLC, $XLK) lagging and oversold sectors leading.  Of course, the drop in interest rates helped rate sensitive sectors (e.g. $XLRE, $XLU), but materials and health care also performed well.

Weekly price performance of S&P500 sector ETFs

S&P Sector Performance for Week 28 of 2024

This shift in market breadth benefited small caps the most, with growth and value names significantly outperforming other styles.  On the other side of the coin, large/mega cap growth names underperformed, along with safety plays like quality and momentum.

Weekly price performance by sector style

Sector Style Performance for Week 28 of 2024

Bitcoin led all asset classes, after 5 weeks on the downside, while oil underperformed.

Weekly price performance by asset class

Asset Class Performance for Week 28 2024

COMMENTARY
Federal Reserve Chair Powell didn’t rock the boat with any of his comments last week, instead towing the line of data dependency.  Market odds for a September rate cut have increased, although inflation readings continue to show signs of “stickiness”.

The consumer price index (CPI) fell for a third straight month, down to 3% y/y in June, from 3.3% y/y in May.

CPI (y/y) Actual Prior
Expected
Headline +3.0% +3.3% +3.1%
Core +3.3% +3.4% +3.4%

On the other hand, Producer prices (PPI) increased 2.6% y/y in June, rising from 2.4% in May (and that’s after May’s number was revised higher from 2.2% to 2.4%).

PPI (y/y) Actual Prior
Expected
Headline +2.6% +2.4%* +2.3%
Core +3.0% +2.6%* +2.5%

In terms of price action, Thursday’s session was most interesting.  The SPX ended the day down, despite ~80% the companies in the index closing higher.  This dynamic is the market breadth issue we’ve been seeing recently, only this time in the negative direction.  The largest market capitalization stocks (i.e. Mag 7) encountered aggressive selling, thereby taking the index along for the ride.

Best to Your Week!

P.S. If you find this research helpful, please tell a friend.
If you don’t, tell an enemy.

Sources: Bloomberg, CNBC, Federal Reserve Bank of St. Louis, Hedgeye, Stockcharts.com, U.S. Bureau of Economic Analysis, U.S. Bureau of Labor Statistics

Invest Safely, LLC is an independent investment research and online financial media company.  Use of Invest Safely, LLC and any other products available through invest-safely.com is subject to our Terms of Service and Privacy Policy.
Not a recommendation to buy or sell any security.
Posted in Historical Data, Market Trends | Tagged , , , | Comments Off on Weekend Stock Market Outlook – July 14 2024