
Stock Market Outlook: April 19th = Uptrend
The stock market outlook returned to an uptrend on Monday, while in the process of a historic move to new all time highs.
Bitcoin, Emerging Markets, Technology and High Beta names led assets higher, while Oil, Energy, and Low Beta underperformed. CTAs reversed their recent short positioning, pushing equity prices higher as West Asia headlines took down oil and energy.
TREND ANALYSIS
The S&P500 ( $SPX ) rose 4.8% last week, rallying further from September lows and reclaiming widely followed moving averages. The index is now:
- ~5% above the 50-day moving average
- ~7% above the 200-day moving average
We received confirmation of the new uptrend, via the second signal, in short order last week, with the ADX moving to bullish on Monday. And the OBV crossover joined the other indicators in the green later in the week.
- Average Directional Index: Bullish
- Directional indicators crossed on Monday .
- Institutional Activity: Bullish
- No change; trading volume remains subdued
- On-Balance Volume: Bullish
- Back above the long-term average
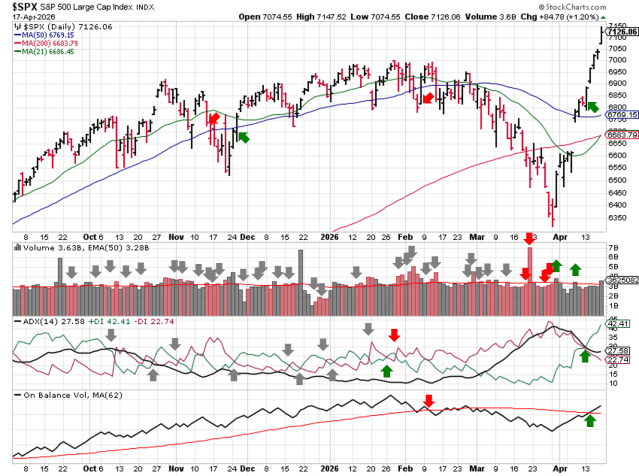
SPX Price & Volume Chart – 2026-04-19
PERFORMANCE HIGHLIGHTS & COMPARISONS
Asset Classes
Bitcoin ( $IBIT ) led assets higher again last week, but Emerging Market Equities were a close second ( $EEM ). Oil ( $USO ) fell on West Asia headlines ( more commentary in the Geopolitics section ), but is still up more than 50% since moving to bullish bias. Bitcoin, Developed Market and Emerging Market Bonds ( $IBIT, $BNDX, $PCY ) regained bullish bias.
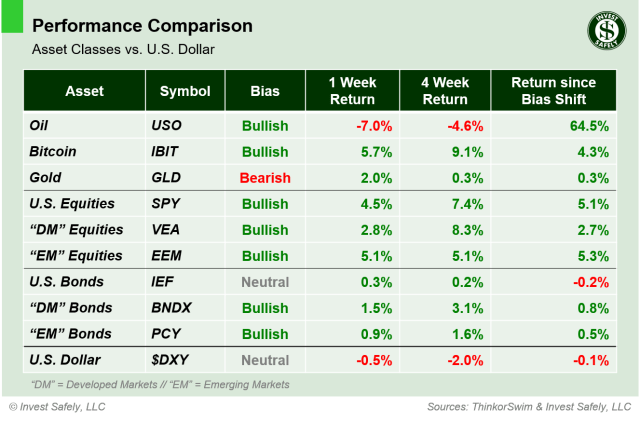
Asset Class Performance – 2026-04-19
S&P500 Sectors
Same situation as the last review: Technology ( $XLK ) outperformed and Energy ( $XLE ) sold off. Communications, Consumer Discretionary, and Financials ( $XLC, $XLY, $XLF) reclaimed bullish bias, and Energy ( $XLE ) dropped to bearish.
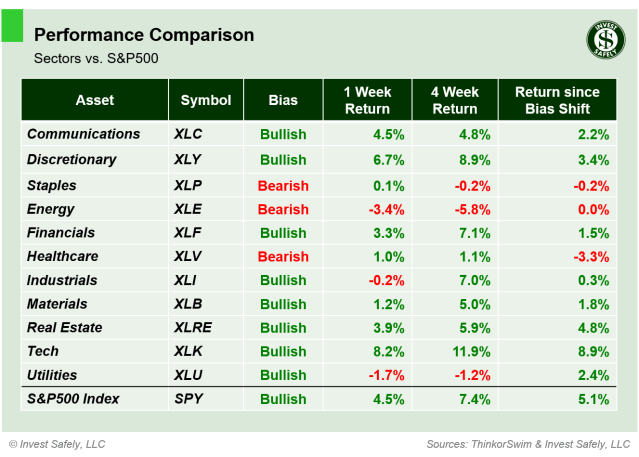
S&P Sector Performance – 2026-04-19
S&P500 Investing Styles
All sector styles were higher last week. High Beta ( $SPHB ) led to the upside, while Low Beta ( $SPLV ) brought up the rear. High Dividend ( $SPHD ) was the worst performer and came in flat. Small Cap and Large Cap growth, along with Quality, got back to bullish bias ( $IWO, $IWF, $QUAL ).
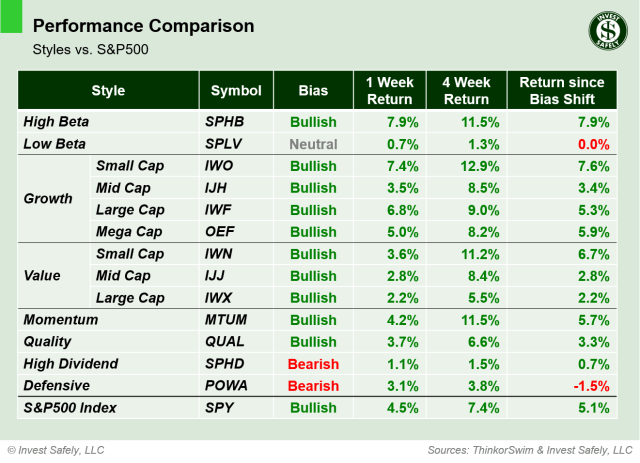
Sector Style Performance – 2026-04-19
COMMENTARY
Markets
We’ve all just experienced a historic run in U.S. equities. The SPX rallied almost 11% in over 11 trading sessions, reversing the correction and moving back to all-time highs. The index has never moved from correction territory to new all time highs that quickly. Not to mention the Nasdaq’s 13 session win streak, which is the longest since 2009.
Per Goldman Sachs:
The last five sessions have garnered one of “the largest in history” trading demand from CTAs ( Commodity Trading Advisors ), or hedge funds that ride market trends. – Reported by Reuters
CTA’s were net short U.S. equities as crease-fire and Hormuz rumors began to circulate. So they were offside of any relief rally and needed to reverse course ( probably long oil too, but that’s just me making an educated guess ).
During rallies, buyers are typically price insensitive; they buy because they want to get in, regardless of price. During sell-offs, sellers are insensitive; they sell because they want to get out, regardless of price.
The theory is that the CTAs got squeezed, with market participants only willing to sell at higher prices ( i.e. where we are now ) due to expectations an end to hostilities in West Asia. You might think that all that buying would manifest as higher trading volume for the index, but that didn’t happen. Despite the large level of CTA buying, other participants were less enthusiastic.
Earnings season kicked off with good showings from major banks, thanks largely to higher interest rates and fees.
Macroeconomic Data & Policy
Inflation remains an issue. March Producer Price index came in at +4.0% y/y, 80 basis points higher than this time last year. Core PPI came in at +3.8% y/y, which is flat versus 2025.
Geopolitics
Despite its uncertain nature, the West Asia ceasefire narrative continues to move global asset prices. High-level peace talks in Islamabad ended without a long-term agreement on April 13th, but equities and commodities responded to Hormuz-related headlines: closures, blockades, re-openings and everything in between. As of this post, the strait is closed again, and there are rumors of a seized Iranian ship.
i
EYES ON THE HORIZON
Earnings reports pick up steam this week. The income Chairman of the Federal Reserve testifies before the Senate Committee on Banking, Housing, and Urban Affairs on Tuesday, giving observers a taste of his upcoming tenure.
- Monday: —
- Tuesday: Retail Sales, Fed Chair-Designate Warsh Testifies
- Wednesday: —
- Thursday: Flash PMIs
- Friday: Revised Consumer Sentiment
Best to Your Week!


