
Stock Market Outlook entering the Week of January 25th = Uptrend
- Average Directional Index: Bearish
- Institutional Activity: Bullish
- On-Balance Volume: Bullish
ANALYSIS
The stock market outlook continues to show an uptrend in place for the S&P500.
The S&P500 ( $SPX ) lost 0.4% last week. The index sits ~1% above the 50-day moving average and ~8% above the 200-day moving average.
Price briefly dipped below the 50-day when the market opened on Tuesday (and a neutral bias), but rebounded the following day. The sharp move flipped ADX directional indicators, but wasn’t accompanied by a wave of institutional selling, so the other signals remain bullish.
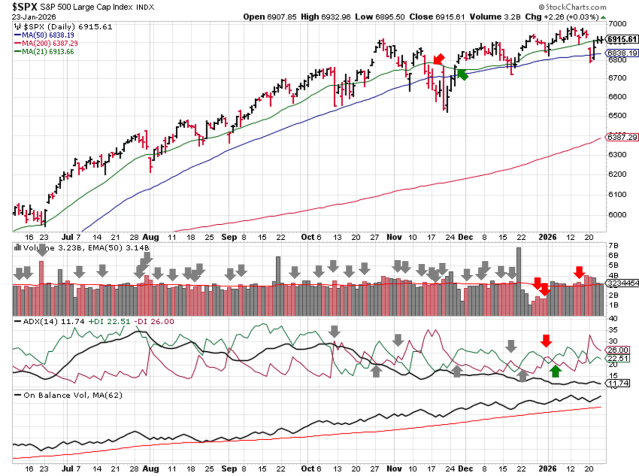
SPX Price & Volume Chart for Jan 25 2026
PERFORMANCE COMPARISONS
Energy ( $XLE ) outperformed and Utilities ( $XLU ) underperformed last week. Communications ( $XLC ) regained bullish bias, while Financials ( $XLF ) dropped to bearish bias.
Energy and Industrials benefited from the rotation out of Technology and Mag-7 names, with Consumer Staples not far behind. Healthcare, one of the strongest sectors coming into 2026, consolidated during the past month.
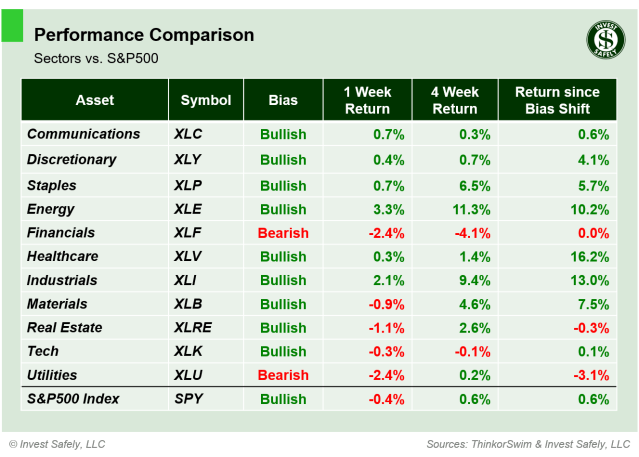
S&P Sector Performance from Week 05 of 2026
Small Cap Value ( $IWN ) led all performers for the third consecutive week, but the overall return return was barely break-even. High Beta ( $SPHB ) was the worst sector style. There were no changes in bias.
Despite the weak price action, Small and Mid-caps continue to outperform ( Value & Growth ), again highlighting a rotation out of Large and Mega Cap tech, rather than outright selling of equities.
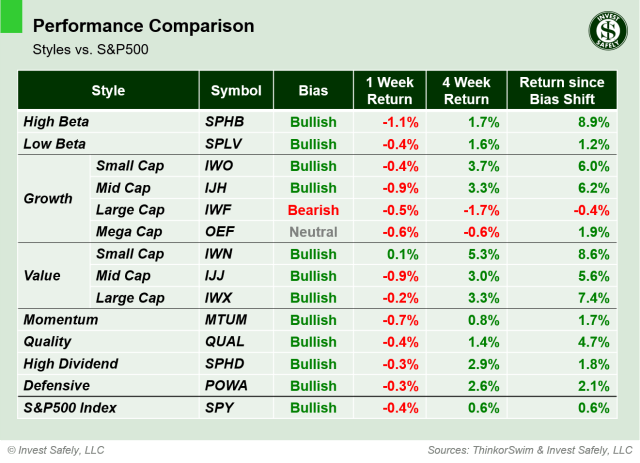
Sector Style Performance from Week 05 of 2026
Gold ( $GLD ) surged higher last week, leaving other asset classes in the dust. Bitcoin ( $IBIT ) was the worst performer, giving back it’s recent gains and falling to bearish bias…as did the U.S. Dollar ($DXY ).
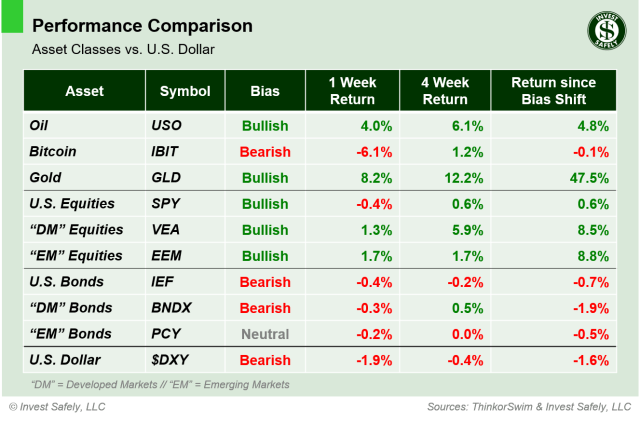
Asset Class Performance from Week 05 2026
COMMENTARY
For 2026, we’ve updated the asset comparison table: equities and bonds for Development Markets ( “DM” ) and Emerging Markets ( “EM” ). The additions won’t overtake volatile assets like bitcoin, or more recently precious metals, since they’re both beholden to their “parent” asset classes. They do provide more insight into global capital flows, which will be useful as we all navigate the 4th turning.
If you aren’t familiar with the “turnings” or generational cycles, do yourself a favor and research Social Cycle Theories; they provide critical insight into the current social and geopolitical upheaval we’re seeing today.
Sidenote: If you haven’t read or listened to the Neil Howe’s books on the subject, do yourself another favor and get them. Or do me a favor and get one or both via these Amazon affiliate links:
- The Fourth Turning: An American Prophecy – What the Cycles of History Tell Us About America’s Next Rendezvous with Destiny
- The Fourth Turning Is Here: What the Seasons of History Tell Us about How and When This Crisis Will End
Speaking of precious metals, gold and silver continue their historic runs, breaking to and through all time highs on an almost daily basis. Other metals and rare earth elements ( Palladium, Platinum, Uranium, Copper, etc. ) are moving as well, though not as dramatically. If you’re allocating to those assets, make sure you’re managing the size of those positions and booking gains when price is in overbought territory.
The final figure for third quarter GDP was +4.4%; higher than initial estimates and year over year, putting the U.S. economy firmly on the growth side. The positive rate of change should show up in 2025 Q4 figures (when released), and carry through this quarter too (Q1 2026).
November PCE ( headline and core ) increased slightly versus October readings. Given the issues with data collection during the government shutdown, don’t put too much faith in these figures.
| PCE (y/y) | Actual | Prior |
Expected |
| Headline | +2.8% | +2.7% | +2.8% |
| Core | +2.8% | +2.7% | +2.8% |
In the “tariff” space, Greenland-related tariffs were dropped, after reports of a “framework for a future deal” regarding the Arctic region with NATO. Then on Saturday, President Trump threatened a 100% tariff on all Canadian imports if Canada finalizes its new trade deal with China (lowering tariffs on Chinese electric vehicles in exchange for reduced Chinese tariffs on Canadian farm products). It’s likely a war of words will ensue. After each side has postured enough to satisfy their constituents, some kind of agreement will be reached.
This week, the FOMC releases their latest decision on interest rates ( Wednesday ), and December PPI is released Friday. We also get Mag 7 earnings from $AAPL, $TSLA, $MSFT, and $META. And there’s the looming possibility of another shutdown for the U.S. government at the end of the week.
Best to Your Week!
PS: If you’re interested in ways to incorporate generational cycle theory into your portfolio, Neil Howe co-leads a fund with Hedgeye Asset Management: https://www.hedgeyeam.com/heft (not an affiliate link or investment advice, just a practical application).
P.S. If you find this research helpful, please tell a friend.
If you don’t, tell an enemy.


