
Stock Market Outlook entering the Week of January 4th = Uptrend
- Average Directional Index: Bearish
- Institutional Activity: Mixed
- On-Balance Volume: Bullish
ANALYSIS
Happy New Year! The stock market outlook kicks off 2026 in an uptrend, with asterisks.
The S&P500 ( $SPX ) fell 1% last week. The index sits 1% above the 50-day moving average and ~10% above the 200-day moving average.
The ADX directional indicators had moved into bullish territory over the holidays, but fell back to bearish Friday; the main average shows a market without trend, corresponding to the index moving sideways since the end of October. The SPX is still above the 50-day moving average, though distribution days are high. The two days of elevated selling during the holidays came on below average trading volumes, so not the strongest signal, but a bearish one nonetheless. So the market outlook remains in an uptrend, while we wait for a breakdown or breakout from the recent trading range.
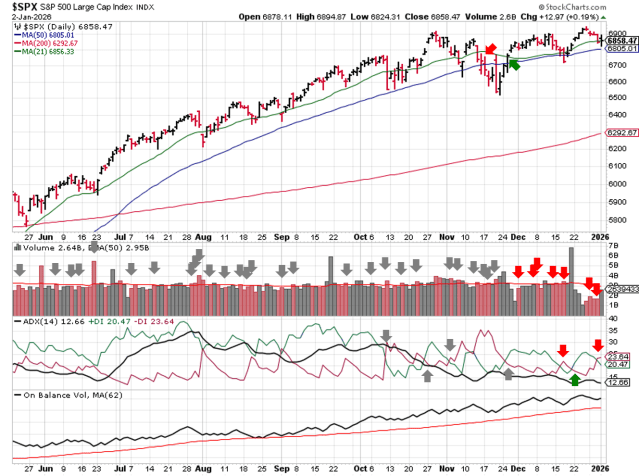
SPX Price & Volume Chart for Jan 04 2026
PERFORMANCE COMPARISONS
We’ll kick off performance comparisons with a look at annual returns for the stock market outlook. During 2025, the $SPX netted a 942 point gain, from the January 2nd open to the December 31st close, for a gain of 16%. During the same time period, the stock market outlook signals triggered six times, creating a net increase of ~1216 points, for a gain of 20.6%.
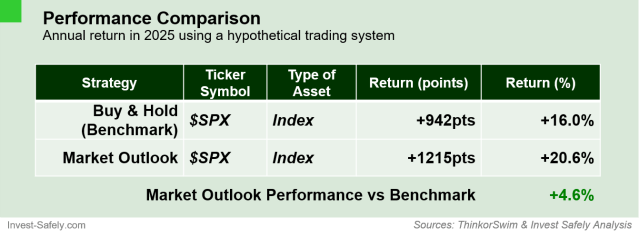
Outlook Performance for 2025
The stock market outlook continues to function as intended: lowering risk of loss. Using the 3-signal combination improved returns by 4.6% versus buying and holding the index. Said another way, these signals reduced losses from the first quarter drawdown by ~5%.
Returning to the near term, Energy ( $XLE ) outperformed last week and Consumer Discretionary ( $XLY ) underperformed. Energy and Technology ( $XLK ) slipped back to neutral bias.
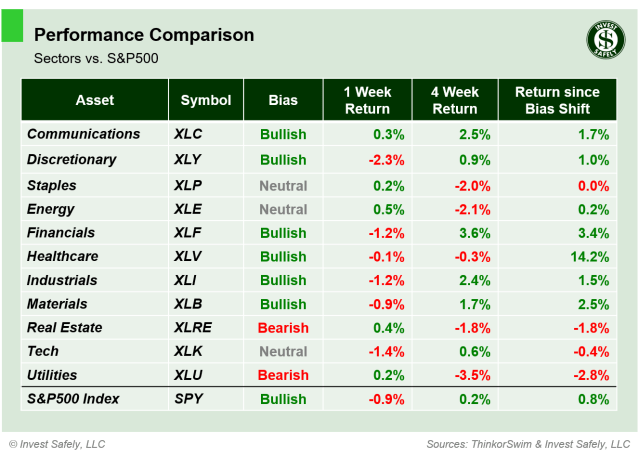
S&P Sector Performance from Week 02 of 2026
High Dividend ( $SPHD ) stocks were the only style to close with a gain; the rest were led lower by Small Cap Growth ( $IWO ). Small Cap Growth, along with Defensives ( $POWA ) , dropped to Bearish bias, while Large Cap Growth, Small Cap Value, and Momentum ( $IWF, $IWN, $MTUM ) slipped to neutral (all from bullish).
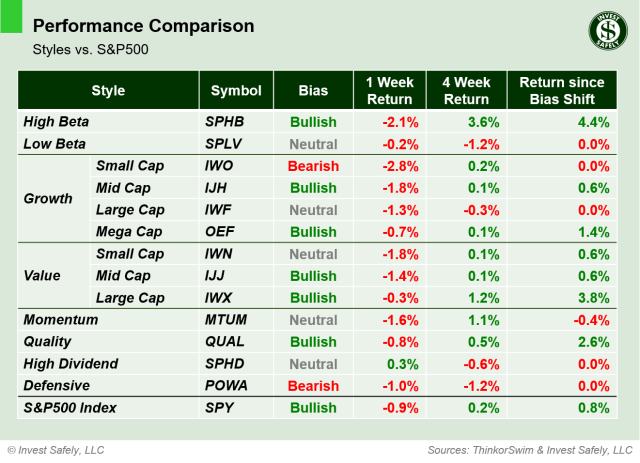
Sector Style Performance from Week 02 of 2026
US Bonds ( $IEF ) were the “best” asset class with a return of 0.1%. That said, they also shifted from neutral to bearish bias. Gold ( $GLD ) leading to the downside.
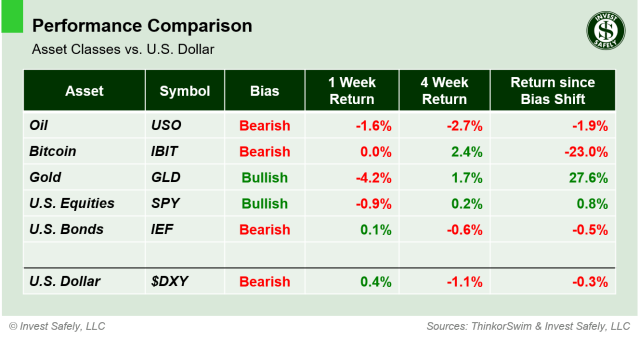
Asset Class Performance from Week 02 2026
COMMENTARY
As we head into January, the overall price and volume action shows the market consolidating for much of the 4th quarter. There’s almost no trend to speak of (per ADX), and institutional investors were shifting their holdings around: high volume selling on the indexes without major price declines. The rotation of flows also showed up in sector biases flipping back and forth for much of the 4th quarter.
On Saturday, investors woke up to news that the Venezuelan President Nicolás Maduro had been removed from office by U.S. forces. Our first peak at market reaction will be Sunday night futures, but it’s safe to assume there will be some volatility when the U.S. markets open tomorrow.
Looking ahead, we’ll get ISM, JOLTS, and NFP later this week. And earnings season kicks off the following week with large banks reporting.
Best to Your Week!
P.S. If you find this research helpful, please tell a friend.
If you don’t, tell an enemy.


