
Stock Market Outlook entering the Week of November 20th = Uptrend
-
- ADX Directional Indicators: Uptrend
- Price & Volume Signals: Uptrend
- Elliott Wave Analysis: Downtrend
ANALYSIS
The stock market outlook stays in an uptrend, with the SPX consolidating CPI-related gains.
The S&P500 ($SPX) fell 0.7% for the week, with trading volume well below average. The index currently sits ~4.5% above the 50-day and ~2.5% below the 200 day moving average.

Technical analysis of daily SPX prices
The ADX signal stayed in bullish territory all week, as did price & volume. Elliott Wave analysis shows the SPX bouncing between the 50% and 61.8% Fibonacci levels of the Intermediate ( W ) wave, as the index enters the final stage of the counter-trend Minor C wave.

SPX Price & Volume Chart for the Week of November 20 2022
Looking at the longer-term, weekly view, shows the SPX just below the 34-week moving average, which has been a reliable place to capture profits since the downtrend began in January.

SPX Elliott Wave Analysis for the Week of November 20 2022
COMMENTARY
Q3 earnings season is winding down, with 476 companies in the S&P500 reporting as of Friday morning.
On average, revenue (sales) grew ~12% year over year, slightly lower than last quarter (14%). The minor decrease shows that higher prices haven’t completely crushed demand just yet. But consumer credit data shows that we’re using more debt to sustain those purchases.
Average earnings only grew ~3% year over year, falling from ~8% last quarter, and shows the impact of inflation on the cost of doing business (i.e. increases in salaries, raw material, etc.).
In both quarters, the energy sector skewed average performance significantly. Sales were up 77% and 50%, while earnings increased 305% and 150% (Q2 & Q3 respectively).
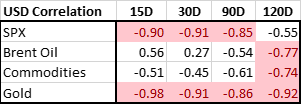
The overall narrative is that earnings weren’t as bad as feared. I’m not sure that tech stock investors would agree, but in general it’s true. Unfortunately, a good deal of the recent market rally is likely the result of US dollar weakness.
In fact, the negative correlation of the SPX to USD has been more -90% over the past 30 days! That’s A LOT.
Looking forward doesn’t improve the picture, because the U.S. yield curve is inverted and continues to signal “recession is coming”. Here are the rates across the curve as of Friday:
- 3 Month = 4.34
- 2 Year = 4.51
- 5 Year = 3.99
- 10 Year = 3.82
- 30 Year = 3.92
Those rates put the inversion of the 10-year treasuries and 2-year treasuries (10s & 2s) at -0.69. That’s the biggest inversion since 1981; bigger than 1989, 2000, 2007, and 2019.

The 10/2 spread from Dec 1976 to Dec 1978 looks very similar to our current run from the March 2021 peak. It’s an important callout, because we know that the current Federal Reserve thinks the 1980s Fed stopped raising rates “too soon” because of recession fears. So this time around, we may see a recession before we get interest rate relief.
A light week coming up, with U.S. markets closed on Thursday and closing early on Friday for the Thanksgiving holiday.
Best To Your Week and Have a Happy Thanksgiving!
P.S. If you find this research helpful, please tell a friend.
If you don’t, tell an enemy.


