
Stock Market Outlook entering the Week of March 20th = Downtrend
-
- ADX Directional Indicators: Downtrend
- Price & Volume Action: Mixed
- Elliott Wave Analysis: Uptrend
ANALYSIS
The stock market outlook is still showing a downtrend; confirmation of the new uptrend hasn’t happened yet. The back and forth of price action continues to create “whipsaw” effects (false signals and/or delay new ones).

2021-03-21-SPX Trendline Analysis-Daily
The S&P500 ($SPX) trended lower last week. The ADX flipped back and forth between bullish and bearish readings during the week (ever so slightly), landing in bearish territory at the time of this post. For the price/volume signal, 2 more distribution days were added to the count, bringing the total to 9. That level of selling isn’t great for the start of a new rally, but the market as a couple more days to get its act together. Price is still above the 50-day, so the signal remains “mixed”.
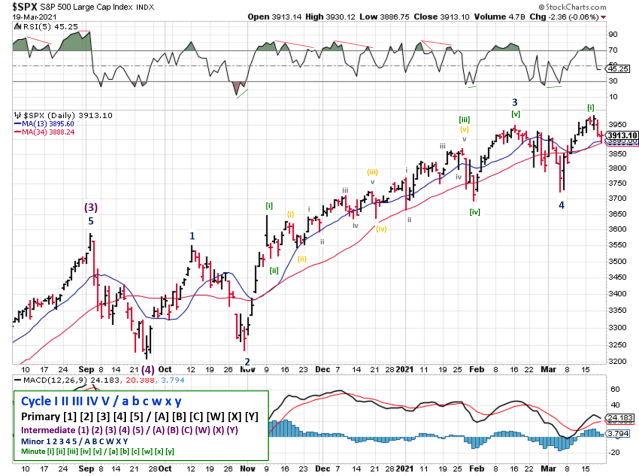
2021-03-21-SPX Elliott Wave Analysis-Daily-Primary1
The current Elliott Wave count shows the S&P is one wave into the Minor 5. I’ve seen many different counts, which is common when the market is trying to figure out which way it wants to go.
COMMENTARY
Last week, many readers took issue with the downtrend signal, because price had just reached an all time high. They’re not “wrong” per se, as anyone looking at a 6 month or 1-year chart can see prices trending higher (myself included). Not to mention how counter-intuitive it is in the face of a massive government stimulus, direct payments to taxpayers, continued bond purchases by the Fed, and a reopening economy.
The questions are actually a good sign; it means readers are thinking for themselves and aren’t blindly following any one signal.
The purpose of the Weekend Market Outlook series is to provide an example of how using rules can limit risk when they’re part of a repeatable decision-making process. That means showing the good with the bad; when rules work and when they don’t. Unfortunately, any rule that limits losses can also limit gains.
If I adjust a signal because I don’t like it, I’ve changed the rules for that one point in time. The “process” is no longer “mechanical” (i.e. repeatable), which makes back-testing and evaluating performance more difficult. Instead, at the end of each year, I analyze whether the system reduced risk and if adjusting the rules could improve long-term performance. Sometimes new rules are better, sometimes they aren’t. At this point, I’m assuming an adjustment will be needed, but you know what people say when you assume.
This week is the one year anniversary of the bottom for the pandemic sell-off. While things are definitely NOT back to normal (unemployment, masks, and vaccines, oh my), the main concern has shifted to interest rates. Treasury yields continue to rise, with investors and traders focused on the 10-year as a sign of inflation. Central banks continue to make the case for keeping interest rates low, and that higher inflation will be tolerated for a while.
Some argue that interest rates aren’t really signaling high inflation as much as they are just returning to normal. Regardless, increasing interest rates are bad news for stocks with valuations that rely heavily on future earnings for any chance at profitability (we’re looking at you SPACs).
Best to Your Week!


