
Stock Market Outlook entering the Week of July 21sth = Uptrend
- ADX Directional Indicators: Uptrend
- Price & Volume Action: Uptrend
- Objective Elliott Wave Analysis: Uptrend
COMMENTARY
No change in the signals this week; the same story as last week: bullish ADX, subdued price/volume, and an uptrend call from OEW.
Earnings season is upon us and a slew of big names report Q2 results this week, including the rest of the FANG stocks: Facebook (FB), Amazon (AMZN) and Alphabet (GOOGL). Analysts expect lower growth, so a surprise could result in oversized moves…in either direction.
The daily chart shows the S&P 500 ($SPX) hasn’t made much progress since mid-June.
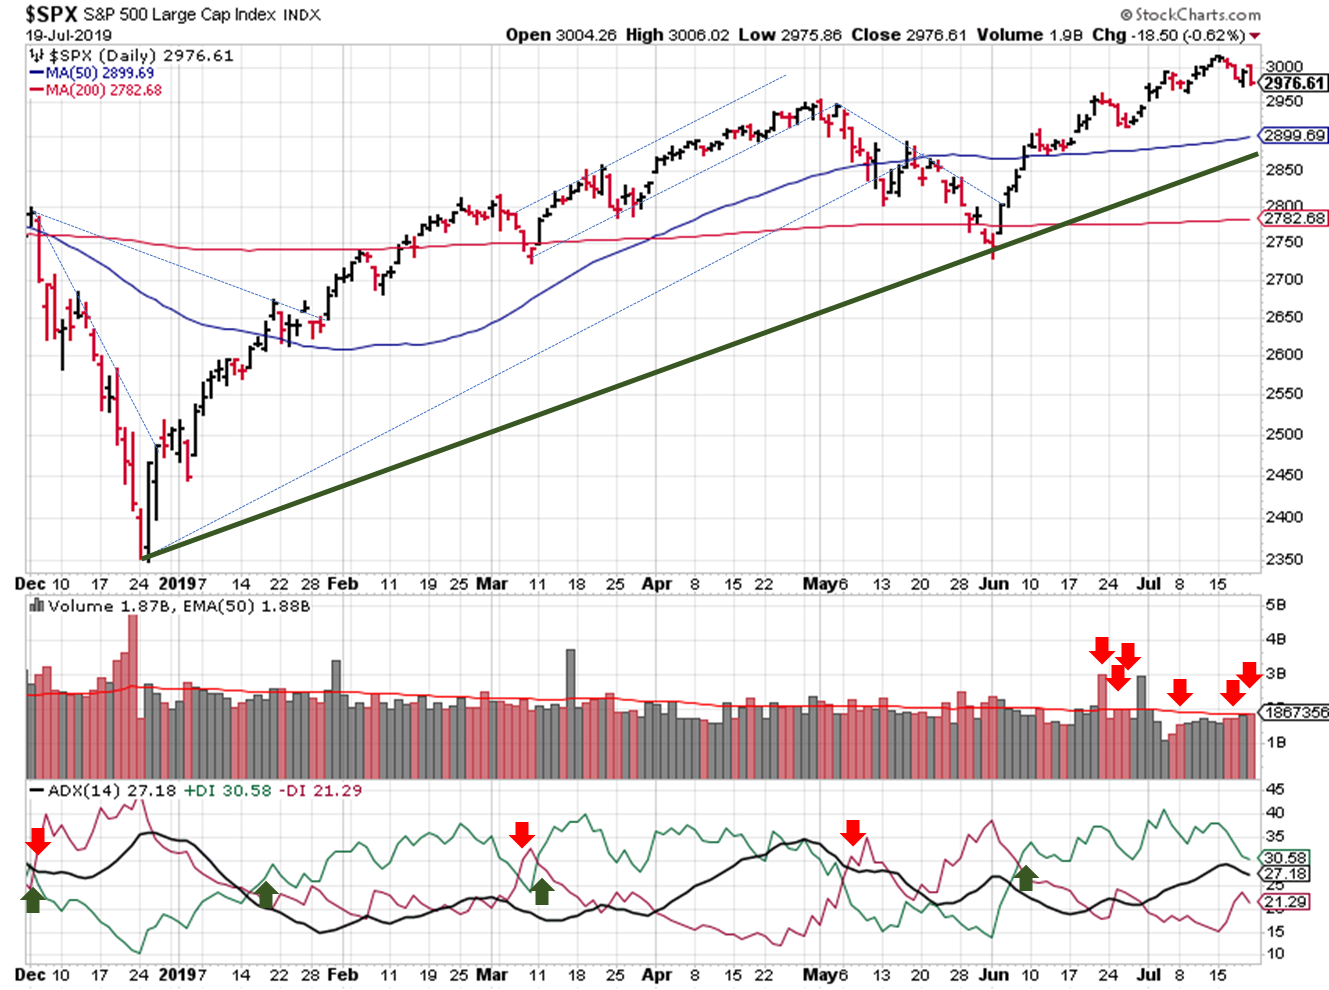
2019-07-21 – SPX Trendline Analysis – Daily
The weekly chart shows the first decline on higher trading volume since December…and below average volume at that. Look at how much prices have risen since that December low!
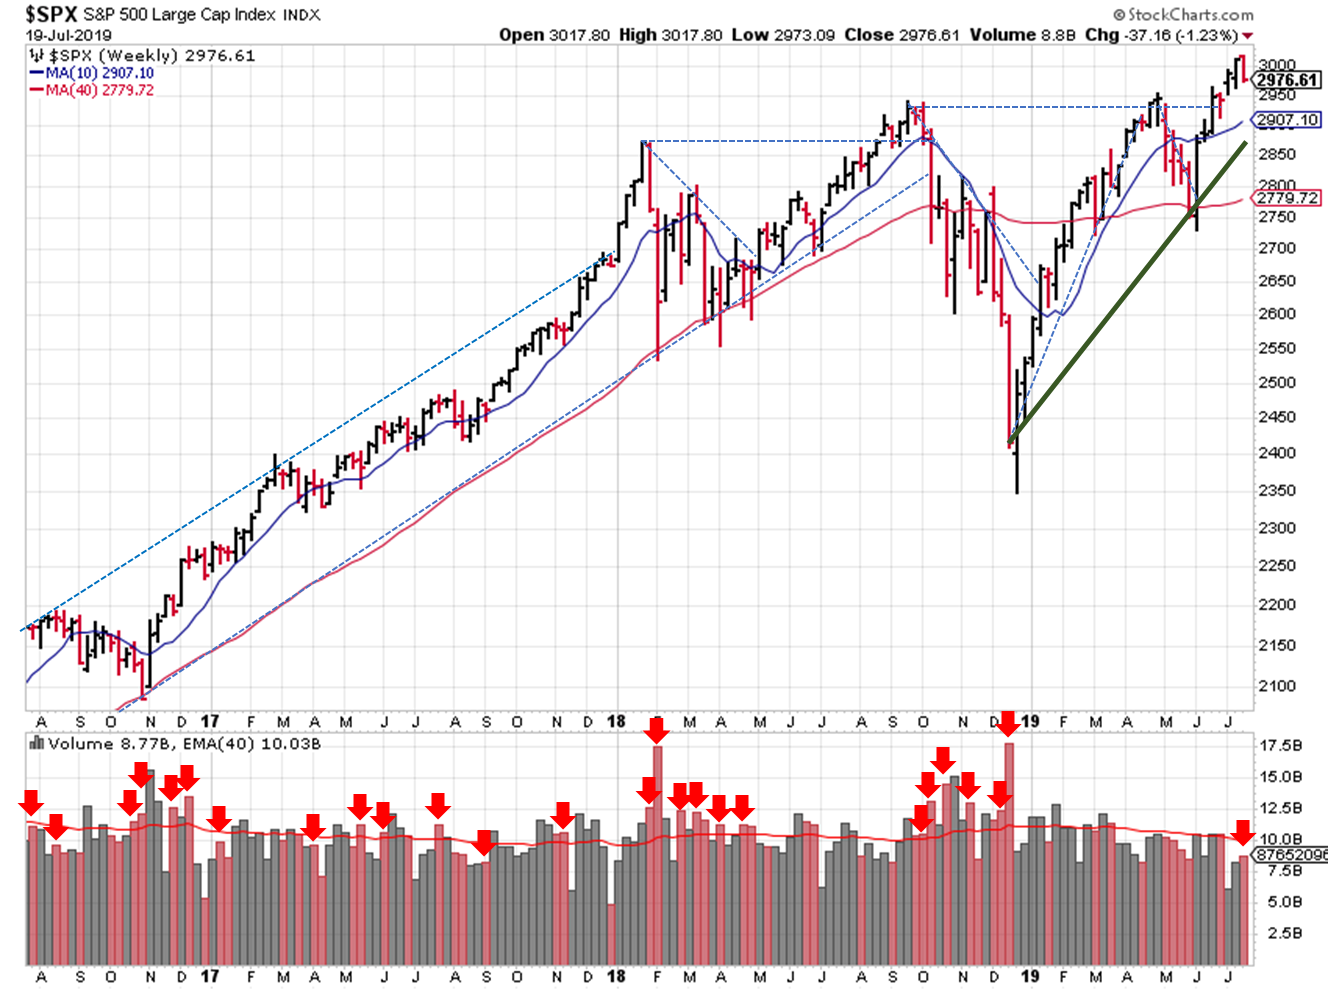
2019-07-21 – SPX Trendline Analysis – Weekly
Weak volume continues to plague the stock market as a whole. It’s hard to put much conviction behind any type of move until volume returns. Leading stocks are no exception. Several growth stocks on my watch list broke out over the past few weeks, but the action left a lot to be desired; <1.5% price moves with anemic trading volume.
Friday was options expiration, which usually produces really high volume. Even that activity couldn’t drive trading volumes up. Is it uncertainty about the U.S. / China trade war? Brexit? The Strait of Hormuz? Will they or won’t they cut interest rates in U.S.?
OEW is still looking for 3,300 on the S&P. If we do see prices fall before that level, look for support between 2,900 and 2,830.
I’ve been part of several “debates” about inverted yield curves and recessions; particularly trying to time when we’ll see the next one. Bear markets occur without recessions, but recessions make bear markets a lot worse. Since we haven’t had a recession in a long time, it’s definitely a worthwhile discussion and something to keep on your radar.
There was agreement on the fact that before every recession in the past 40 years, the yield curve has inverted. Also, that there are times (2 to be exact) when the yield curve inverts, and there isn’t a recession.
There wasn’t agreement on whether the yield curve has or hasn’t inverted this year. I figured this might be something you’re encountering in your research as well, so I wanted to show you the source of the disagreement. There were 2 different criteria for an inverted yield curve:
- 10-year yield < 2-year yield
- 10-year yield < 3-month yield
And as of July 19, 2019:
- 10-year yield = 2.05%
- 2-year yield = 1.80%
- 3-month yield = 2.06%
The 3-month and 10-year inverted back in March; the 2 & 10 year’s haven’t inverted yet.
Which of these datasets you choose to follow is up to you. In either case, it’s safe to say that the yield curve is saying the U.S. economy has issues to work through over the next 12 months, so watch manage your holdings accordingly (position sizing, allocations, etc.).
If you find this research helpful, please forward to a friend. If you don’t find it helpful, tell an enemy. I share articles and other news of interest via Twitter; you can follow me @investsafely. The weekly market outlook is also posted on Facebook and Linkedin.
Charts provided courtesy of stockcharts.com.
If you’re interested in learning more about the relationship between price and volume, or how to find and trade the best stocks for your growth strategy, check out this book on Amazon via the following affiliate link: How to Make Money in Stocks: A Winning System in Good Times and Bad. It’s one of my favorites.
For the detailed Elliott Wave Analysis, go to the ELLIOTT WAVE lives on by Tony Caldaro.
Once a year, I review the market outlook signals as if they were a mechanical trading system, while pointing out issues and making adjustments. The goal is to give you to give you an example of how to analyze and continuously improve your own systems.
- 2015 Performance – Stock Market Outlook
- 2016 Performance – Stock Market Outlook
- 2017 Performance – Stock Market Outlook
- 2018 Performance – Stock Market Outlook


