
Each quarter, JP Morgan Asset Management provides a ton of useful information via its “Guide to the Markets”:
“a comprehensive array of market and economic histories, trends and statistics through clear, compelling charts and graphs you can share with your clients.”
You can find this little gem on JP Morgan’s Asset management website, including the “Guide to the Markets” PDF and audio commentary. Topics include Equities, Fixed Income, International markets, the U.S. economy, as well as alternative investments and investor behavior.
Since this edition covers all of 2018, we can even take a look at annualized asset class performance. Cash was king last year…though with a 1.8% return that’s not saying much.
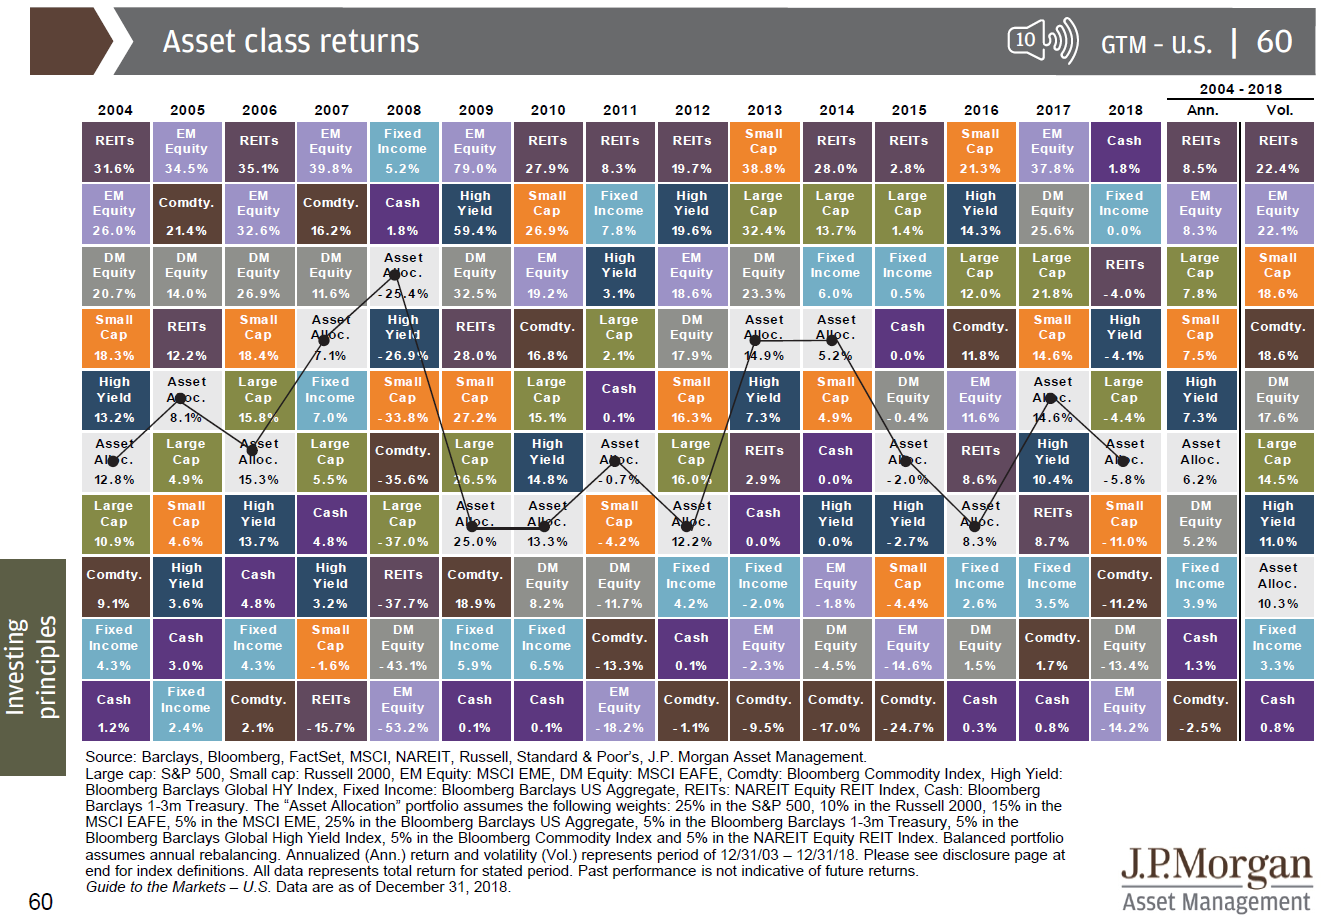
2004-2018 Asset Class Performance – JP Morgan
An inverted yield curve is a pretty good signal for a recession. As discussed before, where not quite there yet. I seems like an inevitable outcome of rate hiking cycles…maybe it will get postponed like the mid-90’s.

US yield curve and recessions – JP Morgan
After the 2018 Q4 sell-off, some valuation measures for the S&P500 look pretty good verses a 25 year average. Forward P/E ratio is affected by our abnormally low interest rates, so I wouldn’t say the S&P is “cheap”. But it’s trending in the right direction if you’re looking to add more dividend plays to your portfolio.
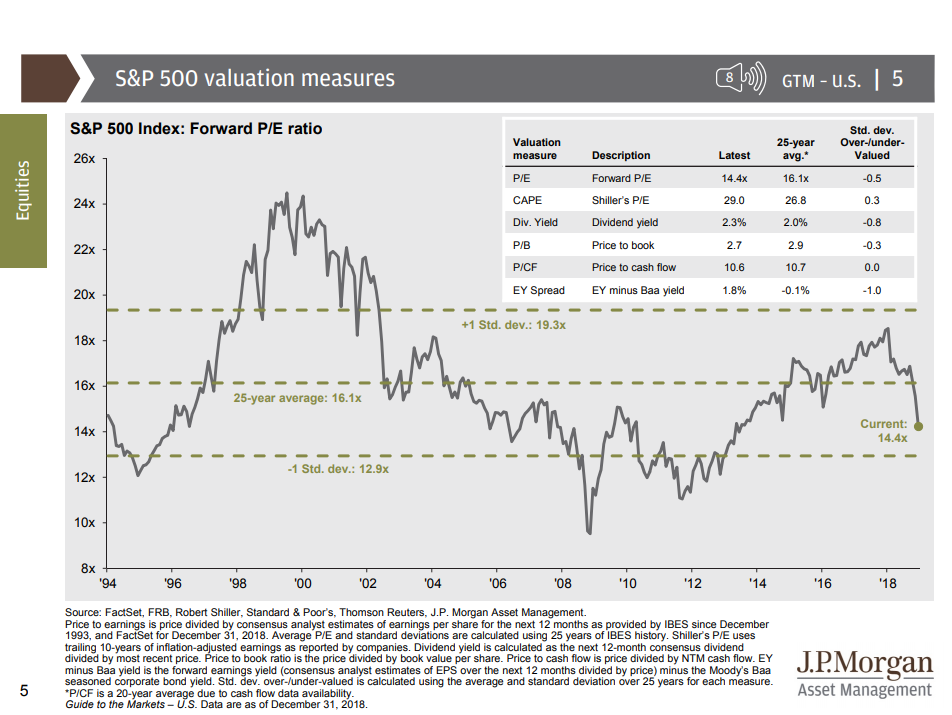
SP500 Valuation Measures – JP Morgan
Sources:
JP Morgan Guide to the Markets: Q1 2019
https://am.jpmorgan.com/blob-gim/1383407651970/83456/MI-GTM_1Q19_Linked.pdf?segment=AMERICAS_US_ADV&locale=en_US


