
Stock Market Outlook entering the Week of November 11th = Downtrend
- 20/50 Day Moving Averages: Downtrend
- Price & Volume Action: Uptrend
- Objective Elliott Wave Analysis: Mixed
COMMENTARY
Investors seemed to like the results of mid-term elections in the US. No political party in total control usually results in gridlock, which mean businesses focus on business. Investors didn’t seem to like the outcome from the Fed meeting, with the high probability of another rate increase in December, as well as expectations for 3 more in 2019.
With the exception of the Dow Jones Industrials, all the indexes continue to trade below their 20 and 50 day moving averages, so no signal change yet.
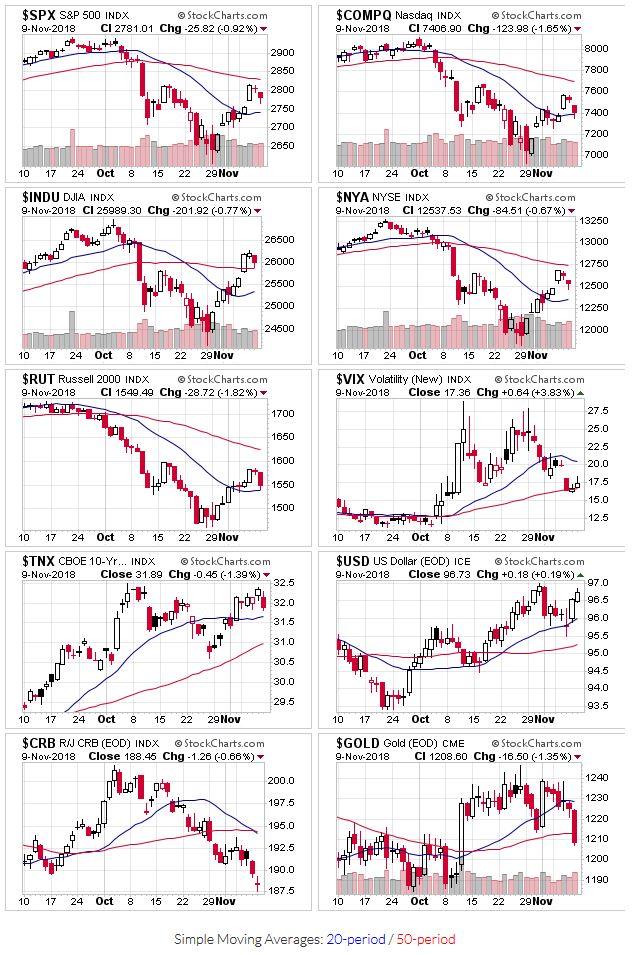
2018-11-11 – US Stock Market Averages
The price/volume signal confirmed an uptrend last week as the indexes jumped back above their 200 day moving averages. Trading volume wasn’t REALLY great and we’re still below the 50-day moving averages for the most part. So it appears to be more of a recovery rally after the fierce selling, reminiscent of earlier this year, rather than a new bull market.
OEW called for a probable uptrend, within the overall downtrend. The expectation is for the S&P to sell off a bit to ~2,700, rally higher, then fall again towards 2,400.
The S&P ($SPX) cleared the 200 day moving average, but then ran into resistance around 2800.
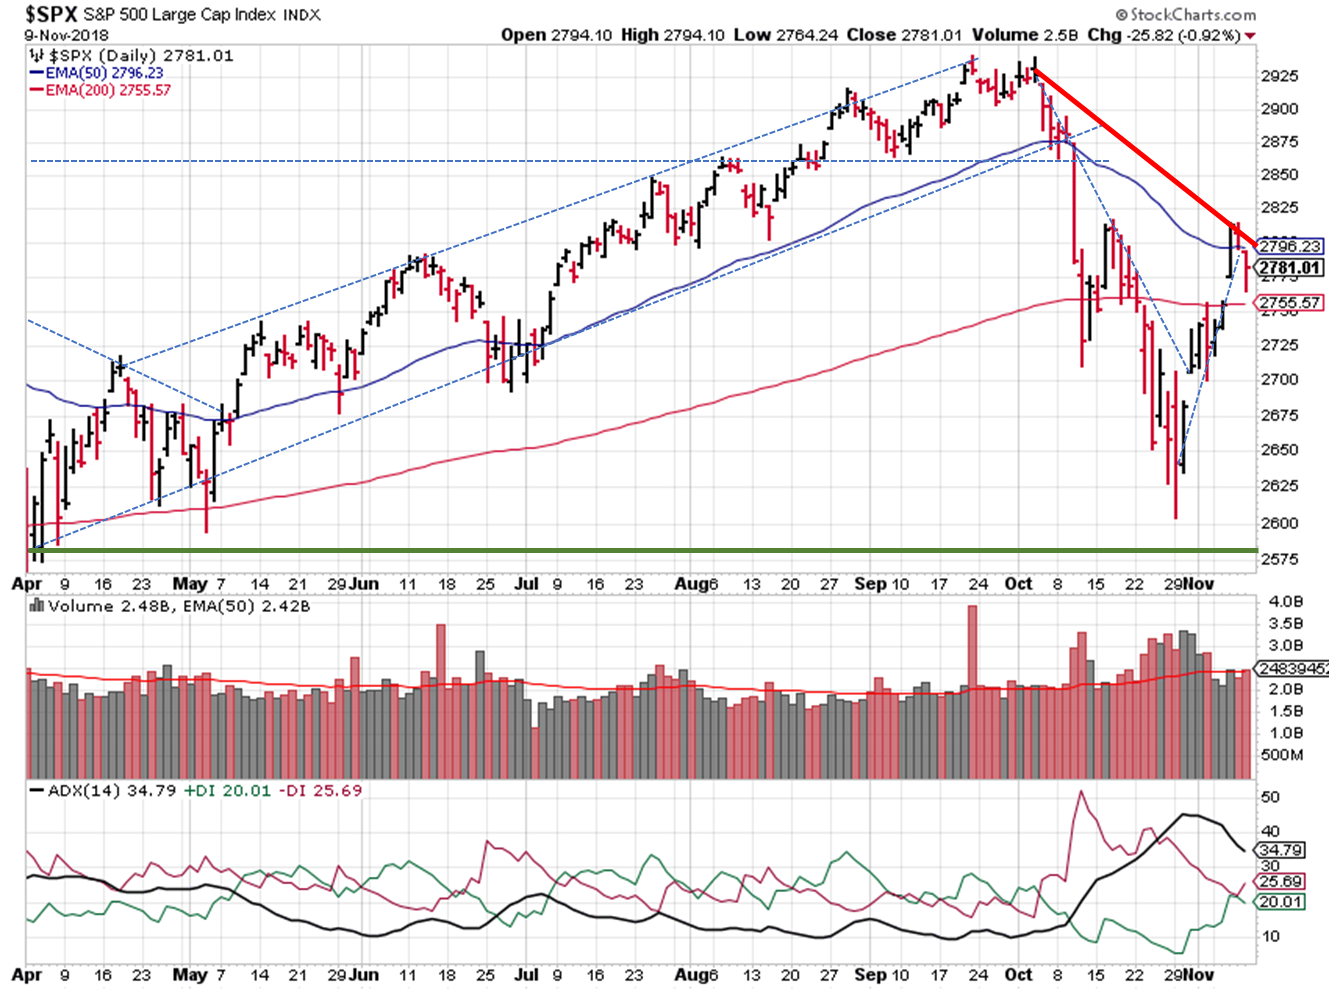
2018-11-11 – SPX Technical Analysis – Daily
Participate. Protect. Prepare.
If you find this research helpful, please tell a friend. If you don’t find it helpful, tell an enemy. I share articles and other news of interest via Twitter; you can follow me @investsafely. The weekly market outlook is also posted on Facebook and Linkedin.
You can check out how well (or poorly) the outlook has performed as a stand-alone, signal generator using past performance estimates:
- 2015 Performance – Stock Market Outlook
- 2016 Performance – Stock Market Outlook
- 2017 Performance – Stock Market Outlook
For the detailed Elliott Wave Analysis, go to the ELLIOTT WAVE lives on by Tony Caldaro. Charts provided courtesy of stockcharts.com.


