
Stock Market Outlook entering the Week of August 26th = Uptrend
- 20/50 Day Moving Averages: Uptrend
- Price & Volume Action: Uptrend
- Objective Elliott Wave Analysis: Uptrend
COMMENTARY
Well…it’s Facebook official; my feed told me that we’re now a part of the longest bull market in history. On Wednesday, the current bull market hit 3,453 days, going back to March 9, 2009. Other articles state that the longest bull market was the 4,494 day version that ran from 1987 to early 2000.
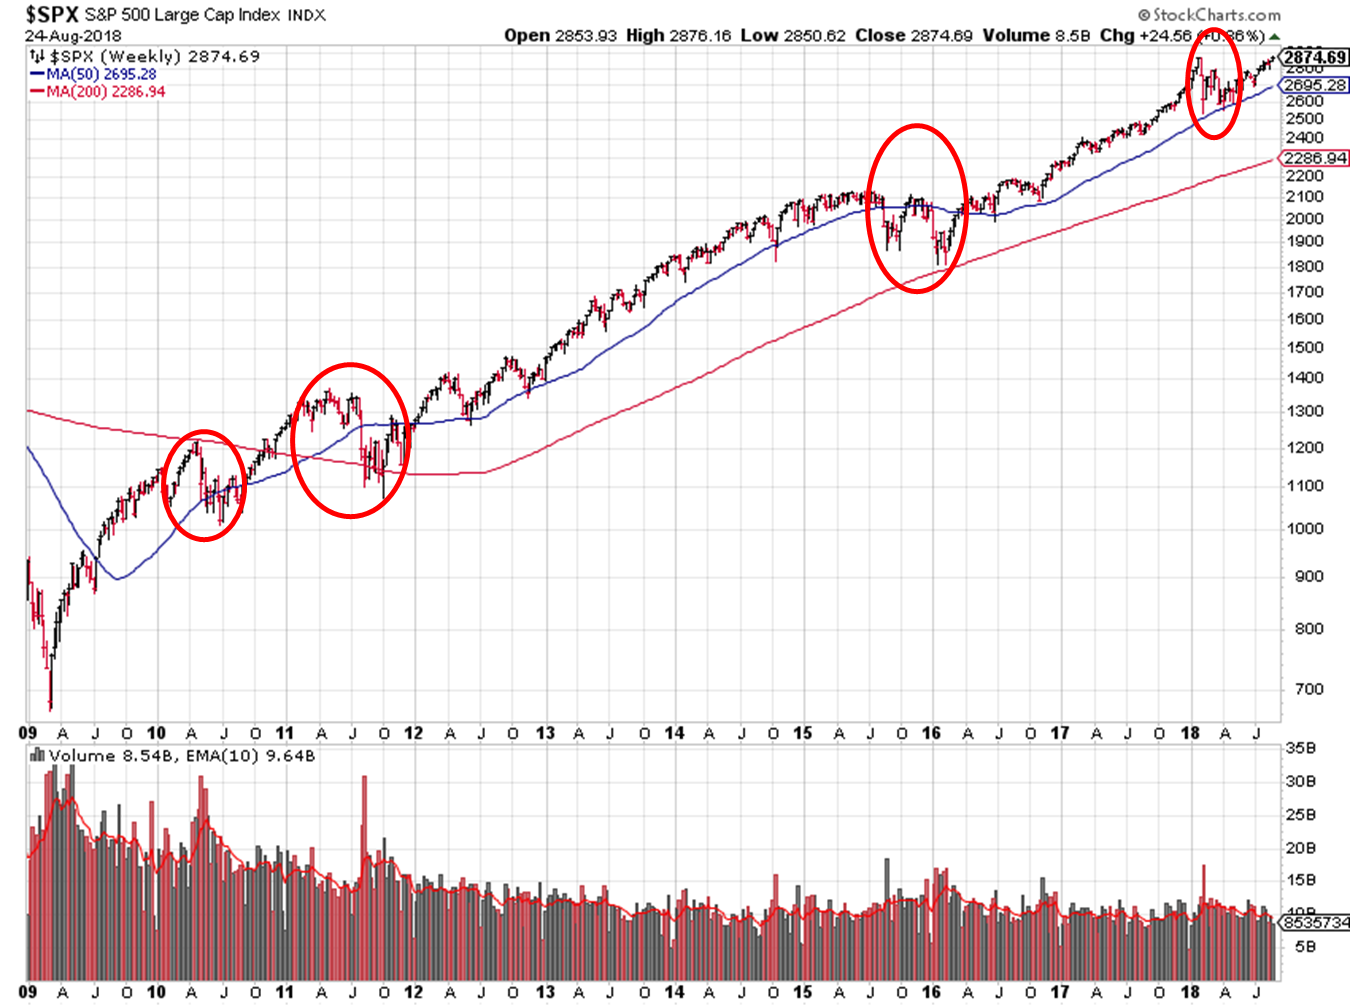
2009-2018 Bull Market – SPX
The debate over 1st or 2nd aside, don’t overlook the nearly 20% declines we saw along the way (e.g. April to June 2010, April to October 2011, June 2015 to February 2016). Those “corrections” were important; large enough to reset expectations, earnings, etc., without triggering the technical definition of a bear market. Even the swift decline earlier this year was a critical cooling off period.
Had any of the corrections ran a little longer and hit bear market territory (>20%), then the longest bull market ever would actually be split into multiple bull markets. Regardless, the run from market lows in 2009 is impressive, and shows the importance of “corrections” along the way. Not to be outdone, commodities (even gold!), are trying to get in on the action, rallying off their lows last week.
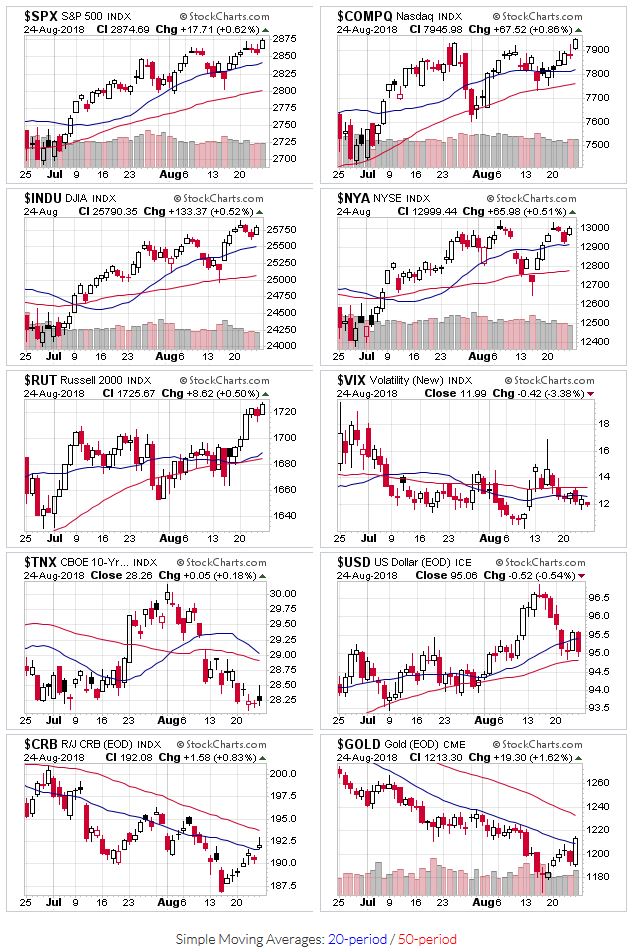
2018-08-26 – US Stock Market Averages
All the indexes start the week above their 20 and 50 day moving averages. The price/volume indicator also keeps its uptrend, as well as the uptrend signal from OEW.
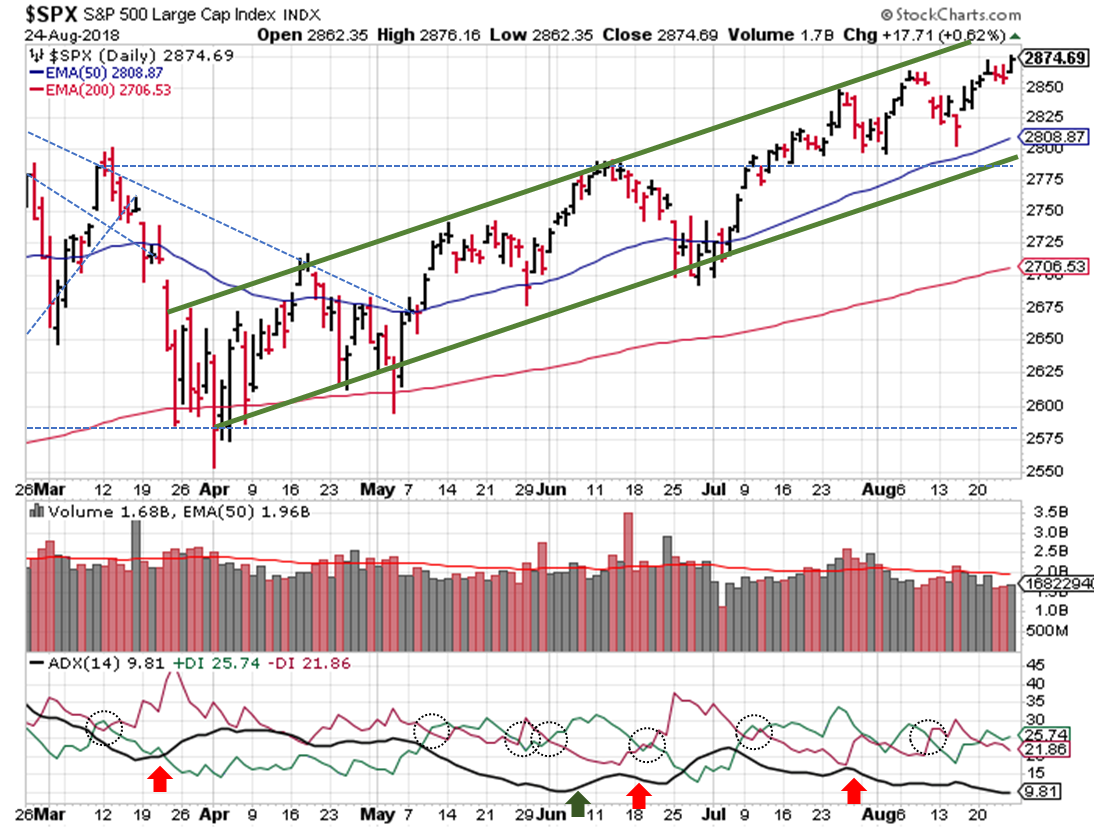
2018-08-26 – SPX Technical Analysis – Daily
The S&P ($SPX) is back at all time highs, ending the week just above the prior all time of 2873 high set in January. The ADX is pitifully weak, but at least it’s still bullish. I’m assuming we’ll see some strength return in September (see below).
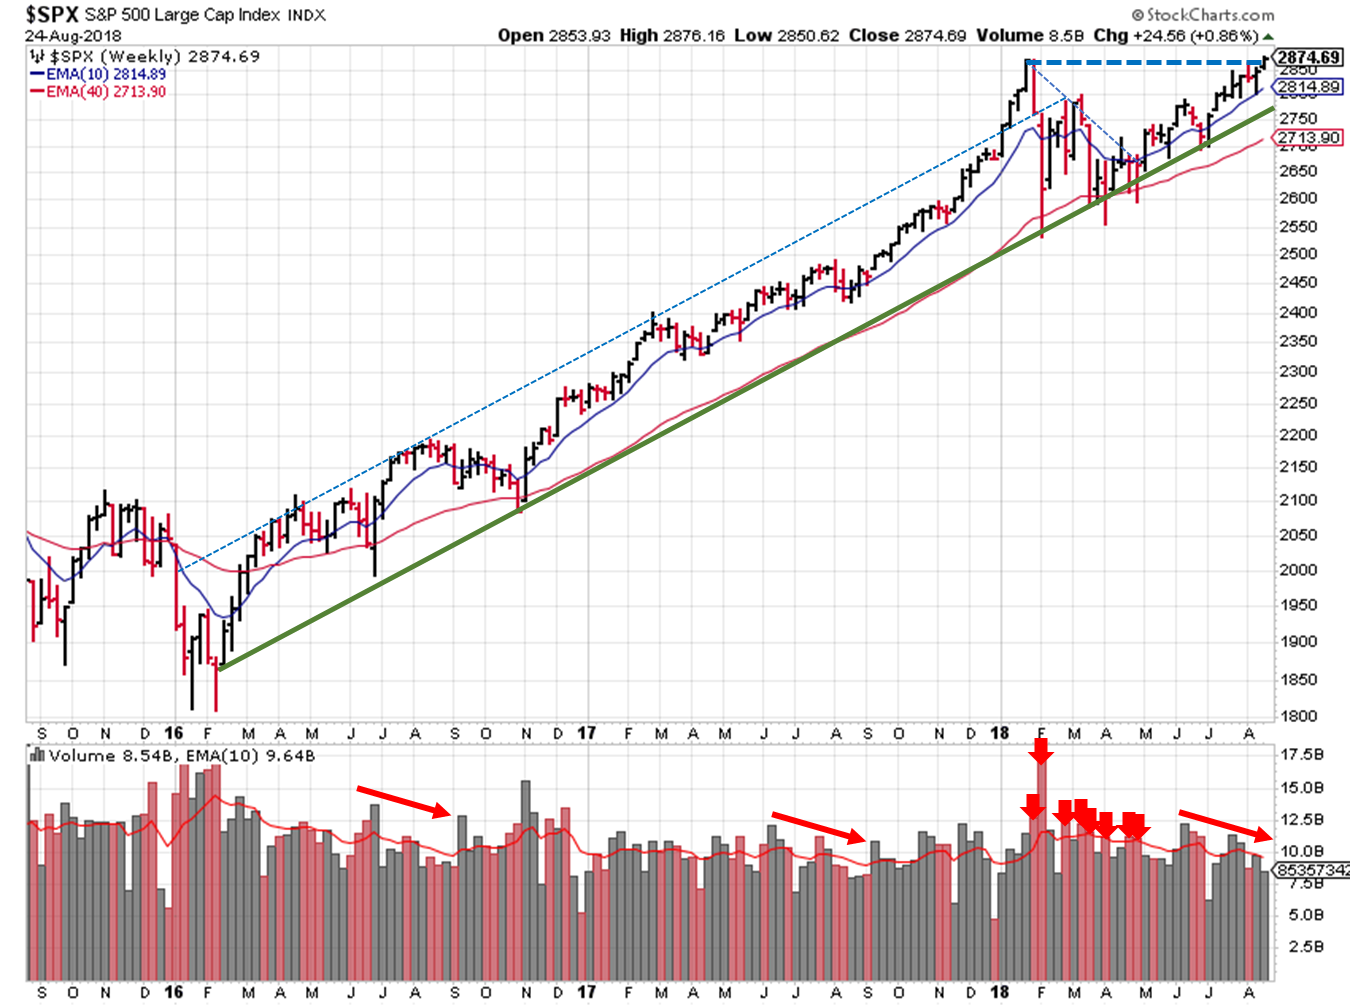
2018-08-26 – SPX Technical Analysis – Weekly
The S&P is still too close to the previous high (less than 2 points) to say it “passed” a key resistance level. Ideally, we’d see a 2-3% upward move in higher trading volume this week, but I doubt it. If past is precedent, we’ll see lower trading volumes this week and next, with a sharp rise during the first full week of September.
Recent breakouts of leading growth stocks have been a mixed back this earnings season. Just crushing earnings expectations isn’t enough…raising guidance is also required these days, which is typical of activity late in a market cycle. Participant, protect, and prepare.
If you find this research helpful, please tell a friend. If you don’t find it helpful, tell an enemy. I share articles and other news of interest via Twitter; you can follow me @investsafely. The weekly market outlook is also posted on Facebook and Linkedin.
You can check out how well (or poorly) the outlook has performed as a stand-alone, signal generator using past performance estimates:
- 2015 Performance – Stock Market Outlook
- 2016 Performance – Stock Market Outlook
- 2017 Performance – Stock Market Outlook
For the detailed Elliott Wave Analysis, go to the ELLIOTT WAVE lives on by Tony Caldaro. Charts provided courtesy of stockcharts.com.


