
Stock Market Outlook entering the Week of February 26th = Uptrend
- 20/50 Day Moving Averages: Uptrend
- Price & Volume Action: Uptrend
- Objective Elliott Wave Analysis: Uptrend
COMMENTARY
US stock markets, generally speaking, paused their advance last week. For what it’s worth, the Dow even managed to keep it’s winning streak alive, hitting 11 straight days of higher closes.
All the indexes remain above their respective 20 and 50 day moving averages.
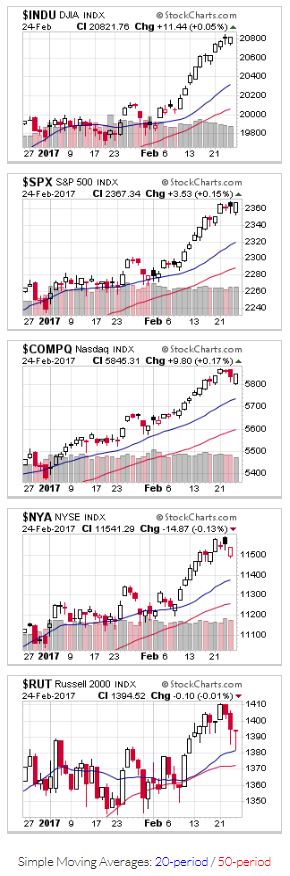
2017-02-26 – US Stock Market Averages
Price and volume action remains positive, although some leading stocks (i.e. those with strong fundamentals) are selling off due to weaker than expected earnings guidance. Distribution days remain in check.
OEW continues to signal an uptrend, with analysis indicating a few more higher highs before we see a 5% pullback.
If you find this research helpful, please tell a friend. I share articles and other news of interest via Twitter; you can follow me @investsafely. The weekly market outlook is also posted on Facebook and Linkedin.
You can check out how well (or poorly) the outlook is tracking the marketing using past performance estimates:
For the detailed Elliott Wave Analysis, go to the ELLIOTT WAVE lives on by Tony Caldaro. Charts provided courtesy of stockcharts.com.


