
Market Outlook entering the Week of August 30th = Downtrend
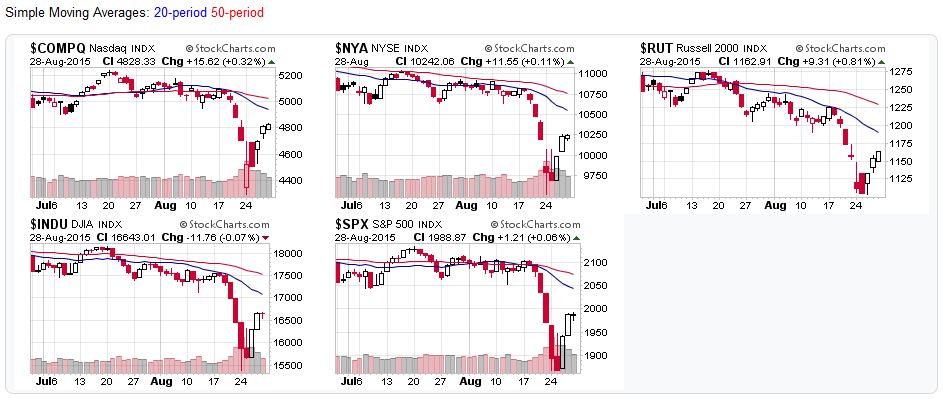
MOVING AVERAGES
- Short-term (20 DMA): Downtrend
All major stock market averages remained below their 20-day moving averages.
- Intermediate (50 DMA): Downtrend
All the major stock market averages remained below their 50-day moving averages.
- Long-term (200 DMA): Downtrend
All of the major stock market averages remained below their 200-day moving averages.
COMMENTARY
Quite the volatile week for global stocks. In the US, we haven’t seen that type of volatility in a really long time. The front half of the week was terrible. Buyers stepped in on the back-half of the week giving the market some relief. But daily trading volumes made the outlook dim; high volume price declines with low volume price increases.
The question on everyone’s mind is what’s next? Was the price action Monday and Tuesday the first step in a longer correction, or did we compact several weeks of selling into a few hours?
Experts have made the case for both. For example, the S&P500 didn’t test the 1,820 support level, so further downside is expected. And if we hit that level, the bull market in US equities is likely over.
On the other side of the fence, US stocks have already recovered a majority of last week’s losses. The S&P500 is well above Tuesday’s low, indicating the worst of the selling is over. We can then expect a rally to reach new highs, potentially in the 2210’s, 2300’s or even 2500’s for the S&p500.
Patience is required, so plan your trades and trade your plan. I’ve got a watchful eye on any positions that didn’t participate in the recovery.
Unless your plan is to trade based on volatility and short-term indicators, now is the time to be defensive (i.e. do not buy large positions, expect large “paper” gains and losses and market prices swing back and forth).
Sources:
For the detailed Elliott Wave Analysis, go to the ELLIOTT WAVE lives on by Tony Caldaro. For price/volume data, head to stockcharts.com.
Moving Average Signals:
- Uptrend=Market indexes remained above their moving average during the trading week
- Downtrend=Market indexes remained below their moving average during the trading week
- Buy signal=Market indexes fell below their moving averages during the trading week
- Sell signal=Market indexes rose above their moving averages during the trading week


