
Market Outlook entering the Week of August 9th = Downtrend
MOVING AVERAGES
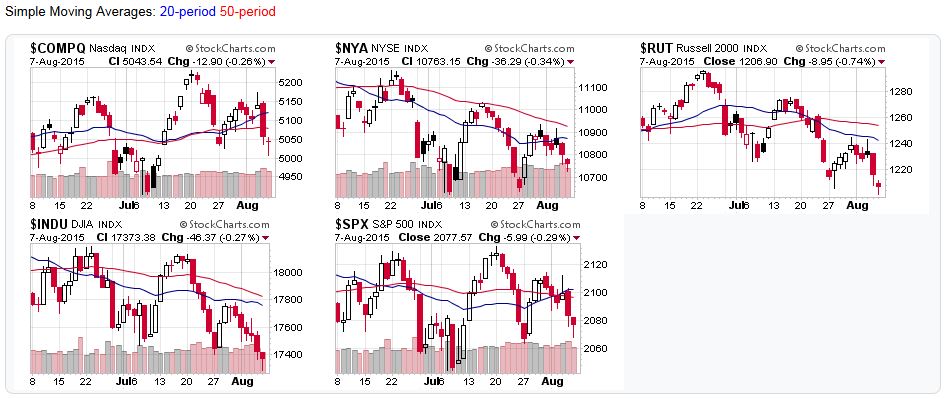
- Short-term (20 DMA): Downtrend / Sell Signal
All major stock market averages fell or remained below their 20-day moving averages.
- Intermediate (50 DMA): Downtrend / Sell Signal
All the major stock market averages fell or remained below their 50-day moving averages.
- Long-term (200 DMA): Downtrend / Sell Signal
2 of the 5 major stock market averages remained above their 200-day moving averages. The Russell 2000 fell below, and the NYSE and DJIA remained below.
COMMENTARY
Now that all the stock indexes are below their 20 and 50 day moving averages, and a majority (3/5) are below the 200 day, the market outlook shifted to downtrend territory.
We dropped through one of last week’s support levels, so intermediate support/resistance levels from Objective Elliott Wave analysis also fell a notch:
- Resistance: 2,085 / 2,131
- Support: 2,019 / 2,070
The S&P500 needs to take out 2,040-2,045 support level before we can truly say we’re in a correction, but that label will come after the fact. Let your stock prices do the talking and don’t profits turn into losses. The last stock on my watch list got hammered last week, so it’s back to the drawing board.
2015-08-09 – US Stock Market Averages
Sources:
For the detailed Elliott Wave Analysis, go to the ELLIOTT WAVE lives on by Tony Caldaro. For price/volume data, head to stockcharts.com.
Moving Average Signals:
- Uptrend=Market indexes remained above their moving average during the trading week
- Downtrend=Market indexes remained below their moving average during the trading week
- Buy signal=Market indexes fell below their moving averages during the trading week
- Sell signal=Market indexes rose above their moving averages during the trading week


