
Market Outlook entering the Week of May 3rd = Mixed
MOVING AVERAGES
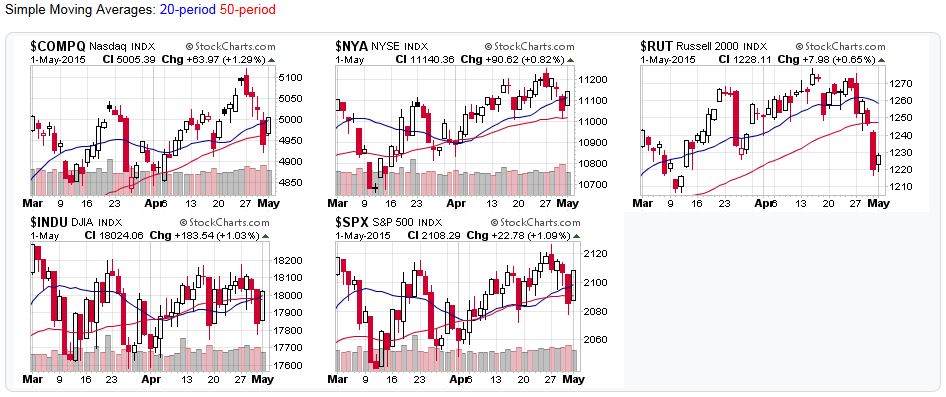
- Short-term (20 DMA): Mixed
All the major stock market averages fell below their 20-day moving averages last week. All but the Russell 2000 were able to recover.
- Intermediate (50 DMA): Mixed
Most of the major averages fell below their 50-day moving averages last week. All but the Russell 2000 were able to recover.
- Long-term (200 DMA): Uptrend
All the major stock market averages remained above their 200-day moving averages
COMMENTARY
The U.S. stock market encountered more high volume selling last week, as all major indexes tested technical support levels. While the uptrend is still intact for the coming week, keep an eye on the small capitalization stocks. Companies in this category usually comprise “market leadership”, and they got pummeled last week.
Elliott Wave support/resistance levels for the S&P500 remain unchanged from last week, but Tony mentions some negative trends (divergences) in his long-term indicators.
- Resistance: 2,131/ 2,198
- Support: 2,070 / 2,085
2015-05-03 – US Stock Market Averages
Sources:
For the detailed Elliott Wave Analysis, go to the ELLIOTT WAVE lives on by Tony Caldaro. For price/volume data, head to stockcharts.com.
Moving Average Signals:
- Uptrend=Market indexes remained above their moving average during the trading week
- Downtrend=Market indexes remained below their moving average during the trading week
- Buy signal=Market indexes fell below their moving averages during the trading week
- Sell signal=Market indexes rose above their moving averages during the trading week


