
Last July, I posted summary statistics for various IVY style investment portfolios alongside some of the more traditional recommended investment portfolios like the 60/40 stock/bond portfolio. See that post here. Now that 2013 is well and gone and that I’ve decided to start posting my musings again, I’ve updated the statistics to include 2013 performance.
Here are the summary stats for the various portfolios from 1973 to 2013.
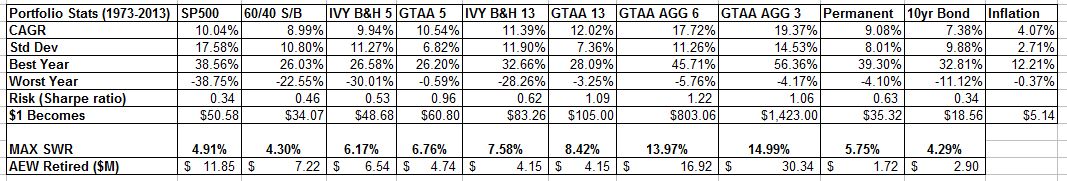
For definitions on the various portfolios and the terms also see the previous post on this topic. As one would expect 2013 did not cause any dramatic changes to the long term performance of the portfolios. Diversified portfolios have done great over the long term and diversified trend following portfolios do even better. The biggest change was to the SP500, 100% stock portfolio, with its gangbuster year in 2013, which bumped up the overall CAGR by 0.5%. Furthermore, when you break…
View original post 196 more words


