Market Outlook entering the Week of Nov 23rd = Uptrend
MOVING AVERAGES
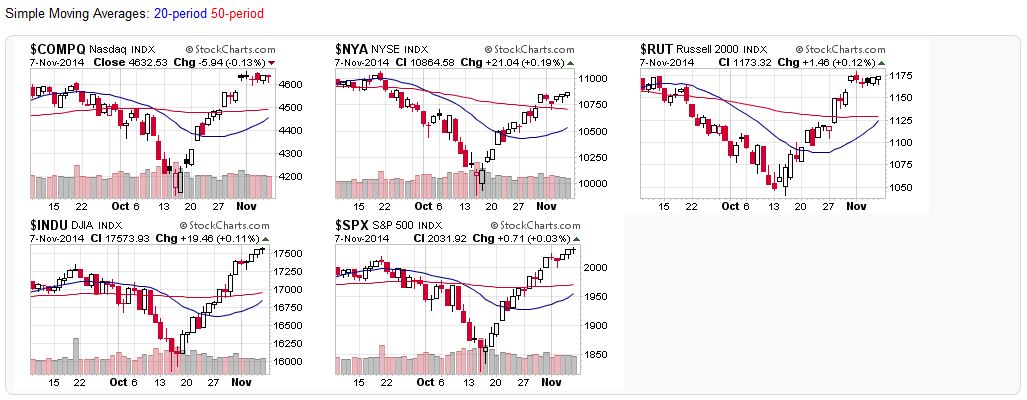
- Short-term (20 DMA): Uptrend
All the major stock market averages ended the week above their 20-day moving averages.
- Intermediate (50 DMA): Uptrend
All the major stock market averages ended the week above their 50-day moving averages.
- Long-term (200 DMA): Uptrend
All the major stock market averages ended the week above their 200-day moving averages.
COMMENTARY
More price action in the markets last week, as the S&P500 was able to break-through the 2,040 level. As mentioned above, all the indexes remain above their moving averages.
William O’Neal’s Big Picture analysis shows a confirmed uptrend with 1-2 distribution days.
Elliott wave analysis indicates that the long-awaited correction (which seemed to be taking hold in October) remains just that…long awaited. For now, the “uptrend that could” keeps on chugging along.
Key S&P500 price levels to watch:
- Resistance: 2,070
- Support: 2,019
A few weeks back, I mentioned that any uptrend in late October would be a good time to adjust your holdings (sell into the rally, so to speak)…which is what I have been doing to my personal holdings. Safe investors are trade to make money, regardless of whether their opinions turn out to be right or wrong. I feel very fortunate to be taking profits even though my sell signal was incorrect and to have another data point that will improve robustness of my system.
Elliott Wave Analysis from the ELLIOTT WAVE lives on by Tony Caldaro

2014-11-15 – US Stock Market Averages