Weekend Stock Market Outlook

Stock Market Outlook entering the Week of August 27th= Downtrend

  • 20/50 Day Moving Averages: Downtrend
  • Price & Volume Action: Downtrend
  • Objective Elliott Wave Analysis: Downtrend

COMMENTARY
A strong showing last Tuesday put stock indexes above their 50 day moving averages, but they failed to hold that level by Friday’s close.  So this week starts with the downtrend intact.

All the indexes begin this week under their 20 day moving averages.  Aside from the DJIA, they’re all under their 50 day moving average as well.  The Russell 2000 remains in bear market territory, starting the week below its 200 day moving average.

Price Action - $INDU,$NYA,$SPX,$USD,$COMPQ,$CRB,$RUT,$GOLD

2017-08-27 – US Stock Market Averages

No change in the price/volume action last week, so we start this week with the downtrend signal.

OEW still shows a probable downtrend, but continues to wait for confirmation.  As mentioned last week, declines during this bull market have been short-lived after an OEW confirmation.

Last week didn’t see any changes in the price action of growth names that made my selection screen (base failures, low-volume breakouts that subsequently failed), so I continue to watch and wait.  None of this is really surprising; August and September have been the worst two months of the year for stocks, over the last 29 years, based on the average monthly price change


If you find this research helpful, please tell a friend. I share articles and other news of interest via Twitter; you can follow me @investsafely. The weekly market outlook is also posted on Facebook and Linkedin.

You can check out how well (or poorly) the outlook has tracked the market using past performance estimates:

For the detailed Elliott Wave Analysis, go to the ELLIOTT WAVE lives on by Tony Caldaro.  Charts provided courtesy of stockcharts.com.


Posted in Historical Data, Market Trends, Other Blogs | Tagged , , , , , | Comments Off on Weekend Stock Market Outlook

Weekend Stock Market Outlook

Stock Market Outlook entering the Week of August 20th= Downtrend

  • 20/50 Day Moving Averages: Downtrend
  • Price & Volume Action: Downtrend
  • Objective Elliott Wave Analysis: Downtrend

COMMENTARY
As expected, the markets bounced back early last week, but trading volume was lacking.  Prices retreated on Thursday, and with most of the indexes below key moving averages and even more institutional selling, the overall market outlook remains in a downtrend this week.

The Russell 2000 continues to lead markets lower, falling below it’s 200 day moving average and entering bear market territory.  That’s no the best sign, considering that market leading stocks are typically small capitalization stocks.  The DJIA remains the last man standing, so to speak.  But even it couldn’t withstand the selling, closing below it’s 20 day moving average last week.  The Nasdaq, S&P500, and NYSE all being this week below their respective 20 and 50 day moving averages.

Price chart for $INDU,$NYA,$SPX,$USD,$COMPQ,$CRB,$RUT,$GOLD

2017-08-20 – US Stock Market Averages

The market indexes added another distribution day or two, along with some stalling action (large price spread, low closing price), so the downtrend signal remains in place.

OEW switched over to a downtrend.  If past is precedence, the downtrend should end soon, as declines during this bull market have been short-lived after an OEW confirmation.

Continuing the recent trend of after-hours price declines (see here and here), last week it was Walmart’s turn to get “Amazoned”.  On the positive side, WMT’s price volatility was nowhere near as bad as what we witnessed with NVDA.

Most of the growth names that made my selection screens over the past few weeks have experienced:  outright base failures, low-volume breakouts that subsequently failed, or are in the process of forming base-on-base patterns.

If you’re sitting on profit, remember that you never want a gain to turn into a loss.  Book some of your profits (>20% gain).  Not quite there?  Take a serious look at your stocks chart and set some short term triggers.

If we are entering a correction, it’s a great time to look for stocks that are already forming bases and don’t get derailed by market sell offs.  These stocks will be the ones that lead the market higher when the correction completes.


If you find this research helpful, please tell a friend. I share articles and other news of interest via Twitter; you can follow me @investsafely. The weekly market outlook is also posted on Facebook and Linkedin.

You can check out how well (or poorly) the outlook has tracked the market using past performance estimates:

For the detailed Elliott Wave Analysis, go to the ELLIOTT WAVE lives on by Tony Caldaro.  Charts provided courtesy of stockcharts.com.


Posted in Historical Data, Market Trends, Other Blogs | Tagged , , , , , | Comments Off on Weekend Stock Market Outlook

Weekend Stock Market Outlook

Stock Market Outlook entering the Week of August 13th = Downtrend

  • 20/50 Day Moving Averages: Downtrend
  • Price & Volume Action: Downtrend
  • Objective Elliott Wave Analysis: Uptrend

COMMENTARY
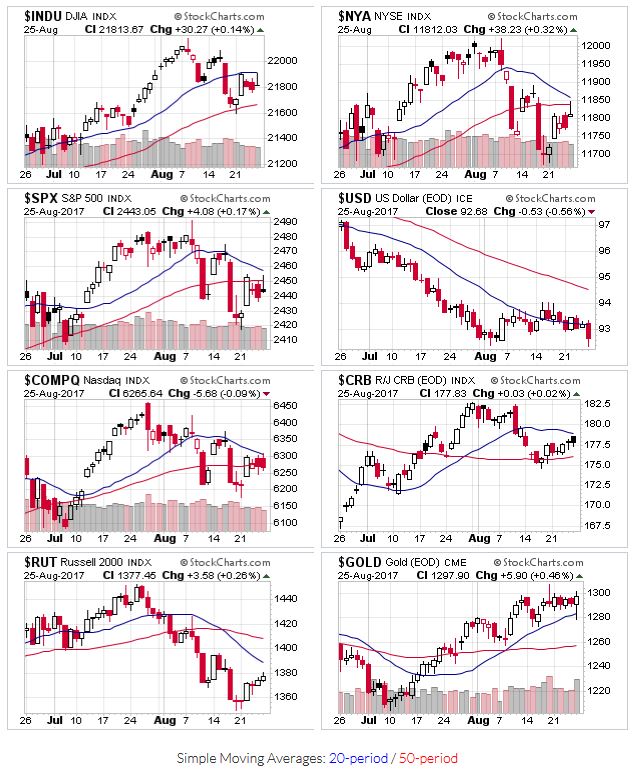
With all the indexes below key moving averages and high levels of institutional selling (in the form of distribution days) clustered over the past two weeks, the overall market outlook shifted to downtrend this week. These periods are usually short lived, so hopefully we’ll see some strength return this week and the indexes will retake key support levels.  In the meantime, investors can take some profits and/or cut mediocre performers loose (see analysis of Nvidia ($NVDA) recent price action below).

It sure seems like the indexes have rolled over, with the Russell 2000 leading markets to the downside, pushing this signal into downtrend territory.  Last Sunday, all the major indexes except the R2K remained above their 20 and 50 day moving averages.  This week, only the DJIA remains at those levels; all the other indexes closed the week below their 20 and 50 day moving averages.  The Russell actually reached its 200 day moving average…any further declines and that index is in bear market territory.

Price Action for $INDU,$NYA,$SPX,$USD,$COMPQ,$CRB,$RUT,$GOLD

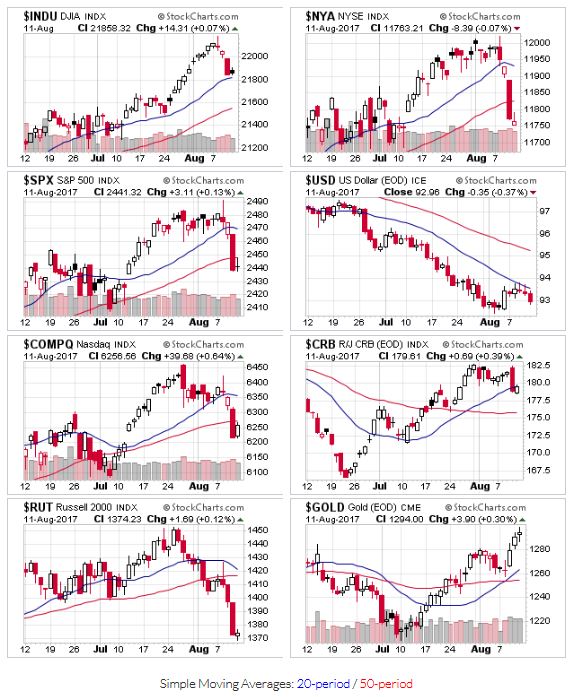
2017-08-13 – US Stock Market Averages

The price/volume indicator also switched to downtrend, price levels are below the 50 day moving average and distribution days are high for all indexes (7 for the S&P500, NYSE, DJIA, and Nasdaq).

OEW remains in an uptrend, although several potential scenarios are under consideration.

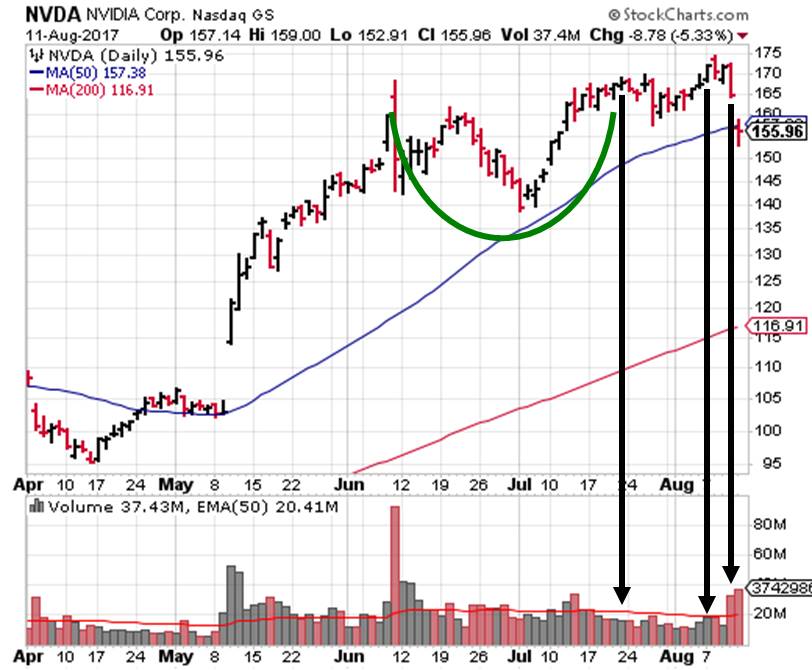
Revisiting last week’s commentary on the recent difficulty holding new positions through earnings, NVDA crushed their earnings on Thursday, raising revenues by 56%, and EPS increasing 124%!  For a stock that has performed so well over the year, to see such a massive earnings beat is surprising.  And after hours, the stock tanked, and continued to fall into Friday’s trading session (currently, talking heads are attributing this to lower than expected revenues in one of their operating segments).

The stock had recently attempted a break-out, so investors looking to initiate a position likely came away frustrated. But this goes back to the point that the markets can stay irrational longer that you can stay solvent.  Whatever the reason for the price action, it happened.  Prices move against you sometimes, and for you at others.  The key is to make sure that you aren’t destroyed when things don’t work out the way you or anyone else thinks they should.


Thoughts on Nvidia ($NVDA)

Fundamentally, the company is sound; sales and earnings have steadily increased, debt is manageable.  Technically, the latest chart pattern wasn’t great for entering new positions, but I’ve seen worse.  Warning signs were there, in the form of weak price action.  Usually this price action precedes an earnings miss, or some other bad news (and a subsequent sell-off).  Not the case with Nvidia.  In fact, given the size of the top and bottom line performance, the situation was ideal for a massive gap up!

Nvidia’s stock price was up 176% over the past 12 months (at Thursday’s close).  It had already broken out a couple times this year, so new bases are more likely to meet increased selling as investors book gains.

2017-08-13 - NVDA - Daily Chart

2017-08-13 – NVDA – Daily Chart

The price pattern cup shape wasn’t symmetrical, met the minimum timeframe of 6 weeks, and trading volume was low as the right side of the base was built in early July.  The stock actually broke out of the base on July 21st, (just barely), but trading volume was below average, and the stock price meandered sideways.  August 7th saw another attempt to rise above resistance at $170, but again, lack of volume showed little conviction from large players.

Looking at the weekly chart puts the sell-off in perspective for buyers of the May breakout.  For all the commotion last week, NVDA sits at the 50 day moving average. Investors with existing positions are likely monitoring price action closely and considering taking profits.

2017-08-13 - NVDA - Weekly Chart

2017-08-13 – NVDA – Weekly Chart


If you find this research helpful, please tell a friend. I share articles and other news of interest via Twitter; you can follow me @investsafely. The weekly market outlook is also posted on Facebook and Linkedin.

You can check out how well (or poorly) the outlook has tracked the market using past performance estimates:

For the detailed Elliott Wave Analysis, go to the ELLIOTT WAVE lives on by Tony Caldaro.  Charts provided courtesy of stockcharts.com.


Posted in Historical Data, Market Trends, Other Blogs | Tagged , , , , , | Comments Off on Weekend Stock Market Outlook

Weekend Stock Market Outlook

Stock Market Outlook entering the Week of August 6th = Uptrend

  • 20/50 Day Moving Averages: Uptrend
  • Price & Volume Action: Uptrend
  • Objective Elliott Wave Analysis: Uptrend

COMMENTARY
A strange week:  The DJIA sits at all time highs, the S&P500 moved sideways, the Nasdaq fell to a support level, and the Russell 2000 entered a downtrend(!).  Over the past two weeks, the Dow has been on a tear, with 9 higher closes and 8 at all time highs.

Except for the Russell 2000, all the major indexes remain above their 20 and 50 day moving averages.

$INDU,$NYA,$SPX,$USD,$COMPQ,$CRB,$RUT,$GOLD

2017-08-06- US Stock Market Averages

No change in the price/volume indicator…still in an uptrend.

OEW remains in an uptrend, with an eye on the 2478 level on the S&P500.

Recent earnings announcements have been make or break for growth stocks, causing prices to gap up or down during after hours/pre-open trading.  Even positive results are not enough to guarantee a positive price move, as companies have beat earnings estimates, but not by a wide enough margin, and then sold off.   This makes investing a bit more risky.  You have to hold a position going into the market close, which is not a big deal for longer term holdings, but makes new positions and/or set-ups difficult to manage. This is why proper position sizing is so important…sell as soon as the position moves against you and keep your losses small!

Best of luck!


If you find this research helpful, please tell a friend. I share articles and other news of interest via Twitter; you can follow me @investsafely. The weekly market outlook is also posted on Facebook and Linkedin.

You can check out how well (or poorly) the outlook has tracked the market using past performance estimates:

For the detailed Elliott Wave Analysis, go to the ELLIOTT WAVE lives on by Tony Caldaro.  Charts provided courtesy of stockcharts.com.


Posted in Historical Data, Market Trends, Other Blogs | Tagged , , , , , | Comments Off on Weekend Stock Market Outlook

Weekend Stock Market Outlook

Stock Market Outlook entering the Week of July 30th = Uptrend

  • 20/50 Day Moving Averages: Uptrend
  • Price & Volume Action: Uptrend
  • Objective Elliott Wave Analysis: Uptrend

COMMENTARY
U.S. equity markets continue to grind higher, with the DJIA pacing the advance.  The NASDAQ, S&P500, and Russell 2000 had a rough go last Thursday as some big names sold off after releasing their quarterly earnings.  That said, volatility remains near all time lows, so moves of 1% generate as much commentary as moves of 2-3% did back in the day.

All the major indexes remain above their 20 and 50 day moving averages.  Commodities (including gold) bounced off their respective 50 day moving averages, confirming their uptrend, while the USD maintains a downtrend.

Price Action for $INDU,$NYA,$SPX,$USD,$COMPQ,$CRB,$RUT,$GOLD

2017-07-30- US Stock Market Averages

No change in the price/volume indicator.  Last week saw trading volume increase, likely due to the number of earnings reports from high-profile companies  (i.e. stocks that make up a large percentage of the indexes).

Still no confirmation from OEW on the correction bounce versus extending rally.  For now, the signal remains in an uptrend.


If you find this research helpful, please tell a friend. I share articles and other news of interest via Twitter; you can follow me @investsafely. The weekly market outlook is also posted on Facebook and Linkedin.

You can check out how well (or poorly) the outlook has tracked the market using past performance estimates:

For the detailed Elliott Wave Analysis, go to the ELLIOTT WAVE lives on by Tony Caldaro.  Charts provided courtesy of stockcharts.com.


Posted in Historical Data, Market Trends, Other Blogs | Tagged , , , , , | Comments Off on Weekend Stock Market Outlook

Weekend Stock Market Outlook

Stock Market Outlook entering the Week of July 23rd = Uptrend

  • 20/50 Day Moving Averages: Uptrend
  • Price & Volume Action: Uptrend
  • Objective Elliott Wave Analysis: Uptrend

COMMENTARY
A solid week of gains puts all three signals back in the green. Trading volume is still a bit low, and may remain so until September.

The markets have staged a nice rally from their near-term lows 2.5 weeks ago; the NASDAQ had led us lower…now it has rallied ~5%! All the major indexes are now well above their 20 and 50 day moving averages.  It’s worth noting that Commodities (including gold) have reached uptrend territory, while the USD continues to fall.

Price trends for $INDU,$NYA,$SPX,$USD,$COMPQ,$CRB,$RUT,$GOLD

2017-07-23- US Stock Market Averages

As mentioned last time, a strong week of trading and a few more distribution days outside the 20 day window has put the price/volume signal back in uptrend mode.

OEW is still looking for confirmation that the former rally is extending, or if this is just a really strong bounce in what is a new correction.  Either way, the uptrend signal remains in place.


If you find this research helpful, please tell a friend. I share articles and other news of interest via Twitter; you can follow me @investsafely. The weekly market outlook is also posted on Facebook and Linkedin.

You can check out how well (or poorly) the outlook has tracked the market using past performance estimates:

For the detailed Elliott Wave Analysis, go to the ELLIOTT WAVE lives on by Tony Caldaro.  Charts provided courtesy of stockcharts.com.


Posted in Historical Data, Market Trends, Other Blogs | Tagged , , , , , | Comments Off on Weekend Stock Market Outlook

Weekend Stock Market Outlook

Stock Market Outlook entering the Week of July 16th = Uptrend

  • 20/50 Day Moving Averages: Uptrend
  • Price & Volume Action: Mixed
  • Objective Elliott Wave Analysis: Uptrend

COMMENTARY
What a difference a week can make.  U.S. stocks pulled themselves out of their holiday funk, and put the major indexes back on solid ground, closing the week at new all time highs or very close to that level.  The one remaining weakness is trading volume.

The Dow Jones remains the leading market average, followed closely by the S&P500.  Both are at new all-time high prices.  The Nasdaq, which had been leading the decline,  isn’t far behind.  Given last week’s strong showing, the market is back in an uptrend from a moving average perspective.

$INDU,$NYA,$SPX,$USD,$COMPQ,$CRB,$RUT,$GOLD

2017-07-16- US Stock Market Averages

The price/volume viewpoint of the markets remains the same; price action supports an uptrend and trading volume doesn’t.  Friday’s rally had the same issue as the week prior: reduced trading volume.  If we have another strong weak, some of older distribution days will fall outside the 4 week window, and this indicator will move back into uptrend territory.

OEW reversed course, putting the markets back in an uptrend.  Either the former rally is extended (something it’s done many times), or we just experienced one of the smallest corrections in recent memory (2-4% depending on the market average you’re looking at, 0% for the Dow).

After several weeks of almost ZERO proper bases in high quality growth stocks, several names popped into my watch list for this week, which is a welcome sign.  Weak price/volume action towards the end of June tripped a lot of sell triggers for my existing holdings, and the lack of fundamentally strong companies with proper technical bases had me concerned about the severity of the next correction.  We’re still overdue, but the probability is lower near term.


If you find this research helpful, please tell a friend. I share articles and other news of interest via Twitter; you can follow me @investsafely. The weekly market outlook is also posted on Facebook and Linkedin.

You can check out how well (or poorly) the outlook has tracked the market using past performance estimates:

For the detailed Elliott Wave Analysis, go to the ELLIOTT WAVE lives on by Tony Caldaro.  Charts provided courtesy of stockcharts.com.


Posted in Historical Data, Market Trends, Other Blogs | Tagged , , , , , | Comments Off on Weekend Stock Market Outlook