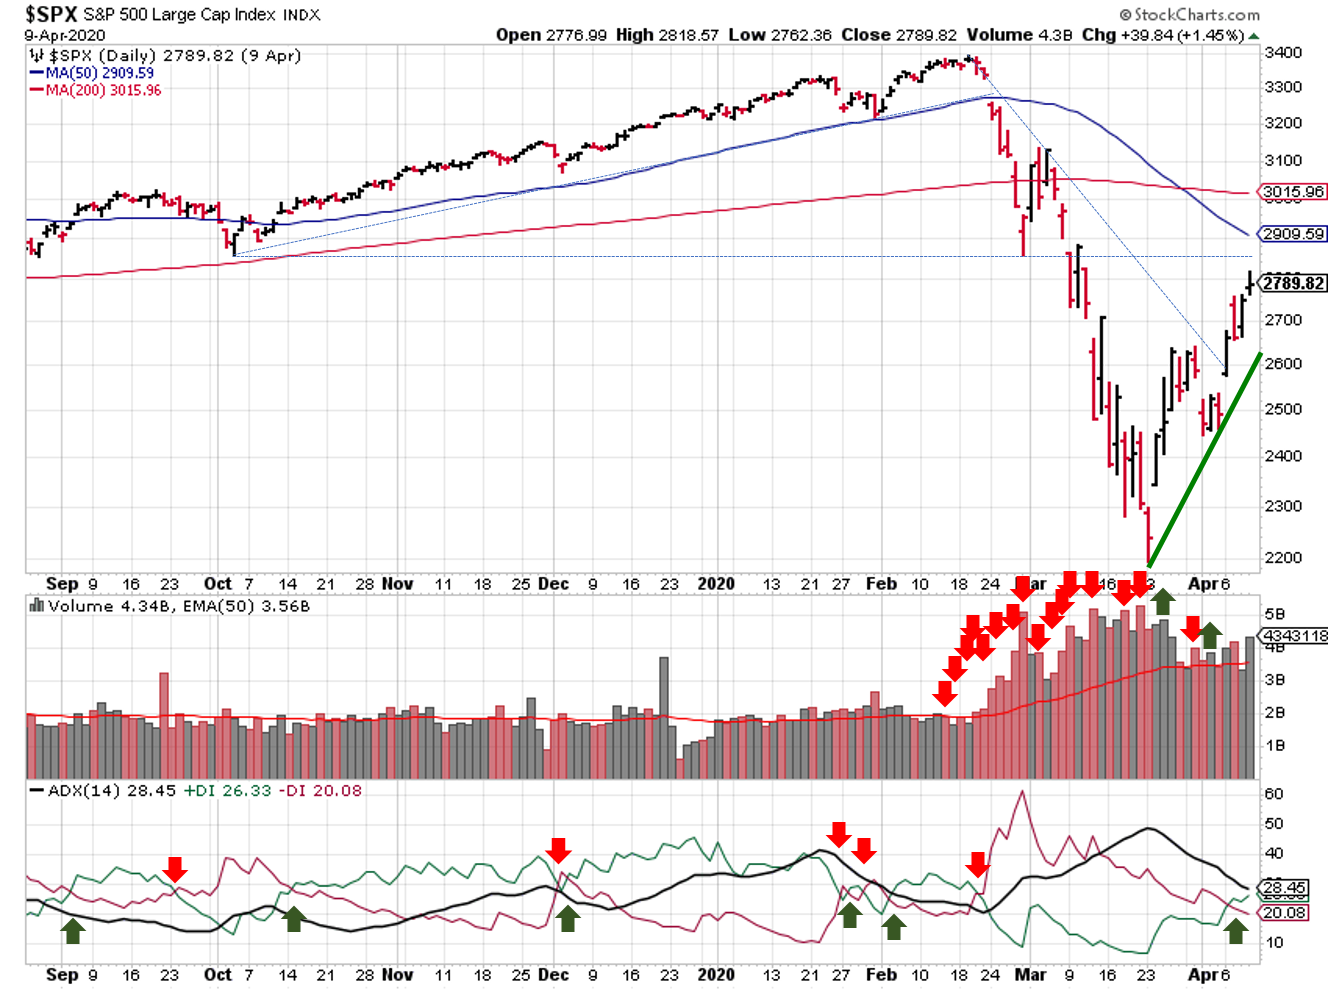
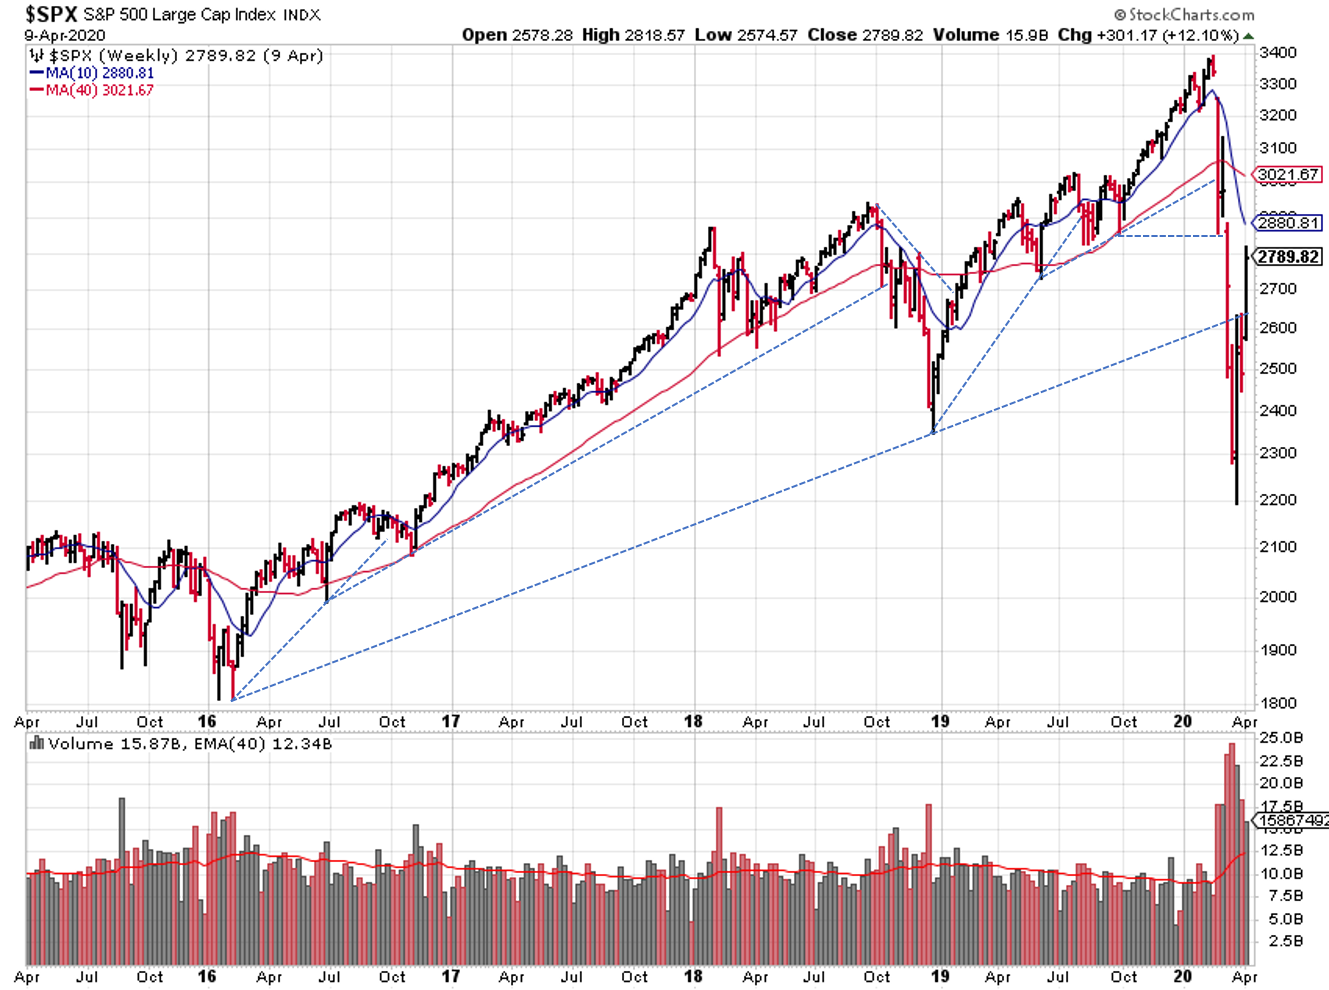
Mid-week Update for the S&P500

I was studying some retracements and price targets today, and came across an issue with the Elliott Wave analysis I posted the over the past few weeks for the S&P500 ($SPX).

I’ve been labeling the recent downtrend as an A-wave with 3 subwaves (a,b,c).

This was incorrect, and is sort of a mish-mash of bullish and bearish waves and labeling.

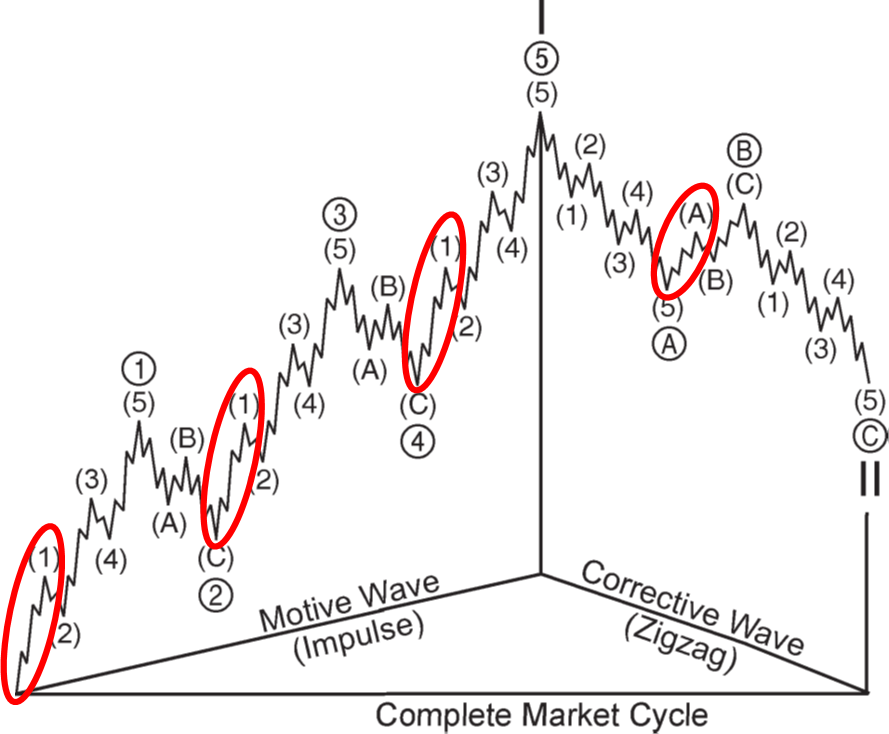
A completed zigzag pattern has 3 waves (A,B,C).  A-wave’s have 5 subwaves (1,2,3,4,5).   B-wave’s have 3 subwaves (a,b,c).

If there were only 3 waves, then the recent downtrend completed all three waves (ABC), and the March low is the end of the C-Wave. This also means that we’re on the left side of the graph, we’re somewhere in the first wave of a new uptrend, on our way to new highs.

General Wave Counts - Motive and Corrective - Elliott WaveIf the recent downtrend was an A-Wave of a broader correction, then there must be 5 subwaves (1,2,3,4,5). This also means we’re still on the right side of the graph, we’re somewhere in the B-wave, on our way to a near-term high before heading to new lows.

The reason for my error is two-fold:  I’m still learning Elliott Wave (I don’t know what I don’t know) and most of the counts I referenced still put us in a larger bull market, so they labeled the entire downtrend ABC.

So now what?  In both cases, bull or bear, we’re looking for 5 waves up from the March low.

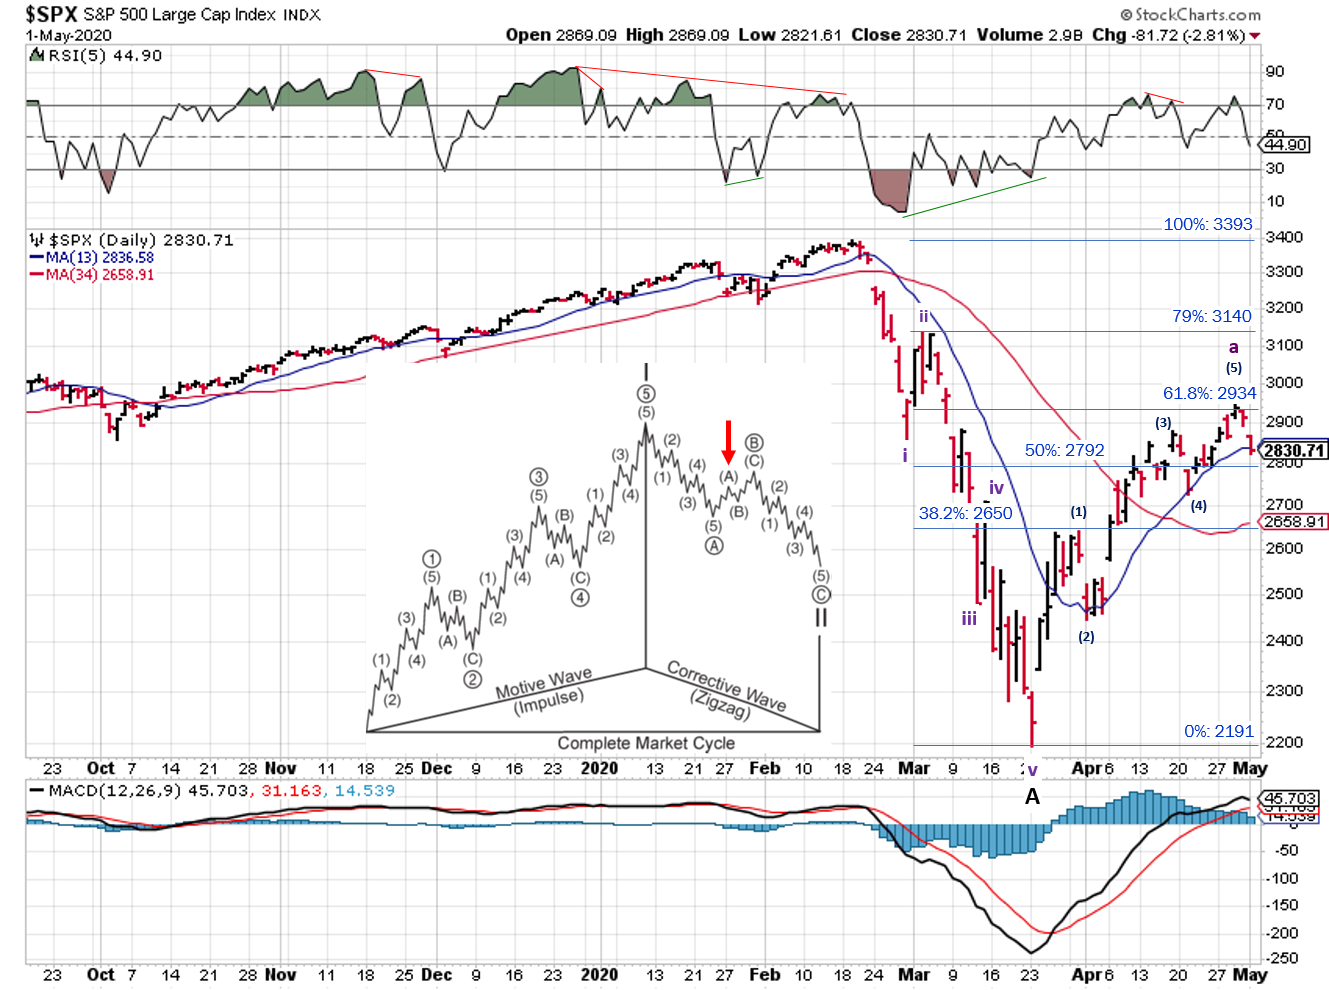
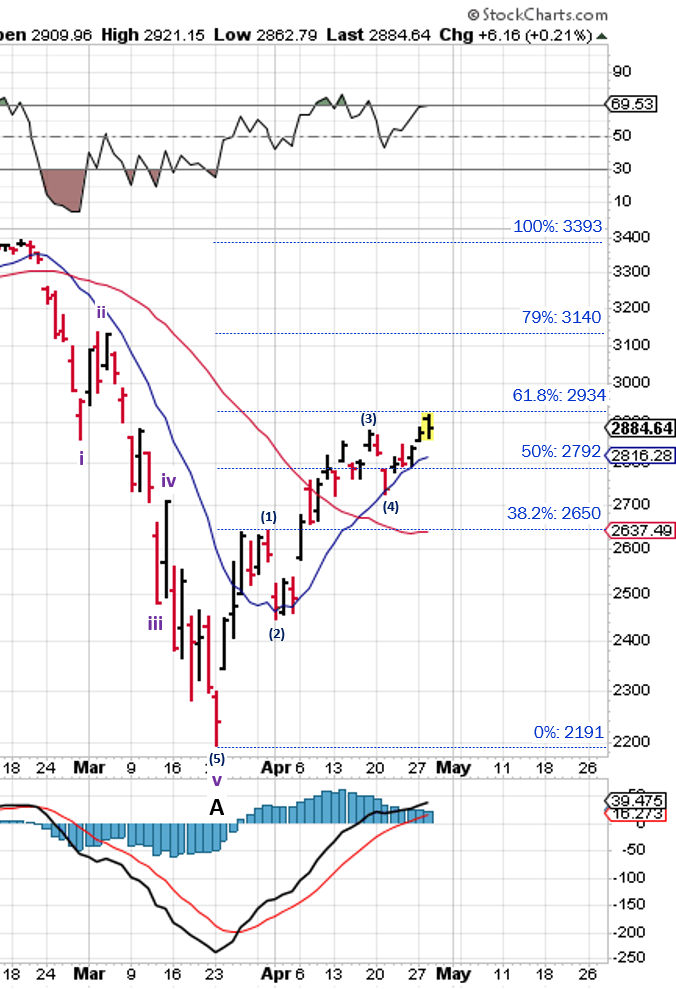
General Wave counts - Motive and Corrective - Elliott WaveI’m still in the bear market camp, so I relabeled the recent downtrend as an A-wave, with 5 subwaves (i,ii,iii,iv,v), as well as the first 4 subwaves ((1),(2),(3),(4)) in the current uptrend.
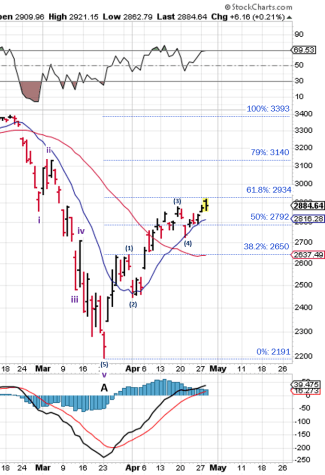
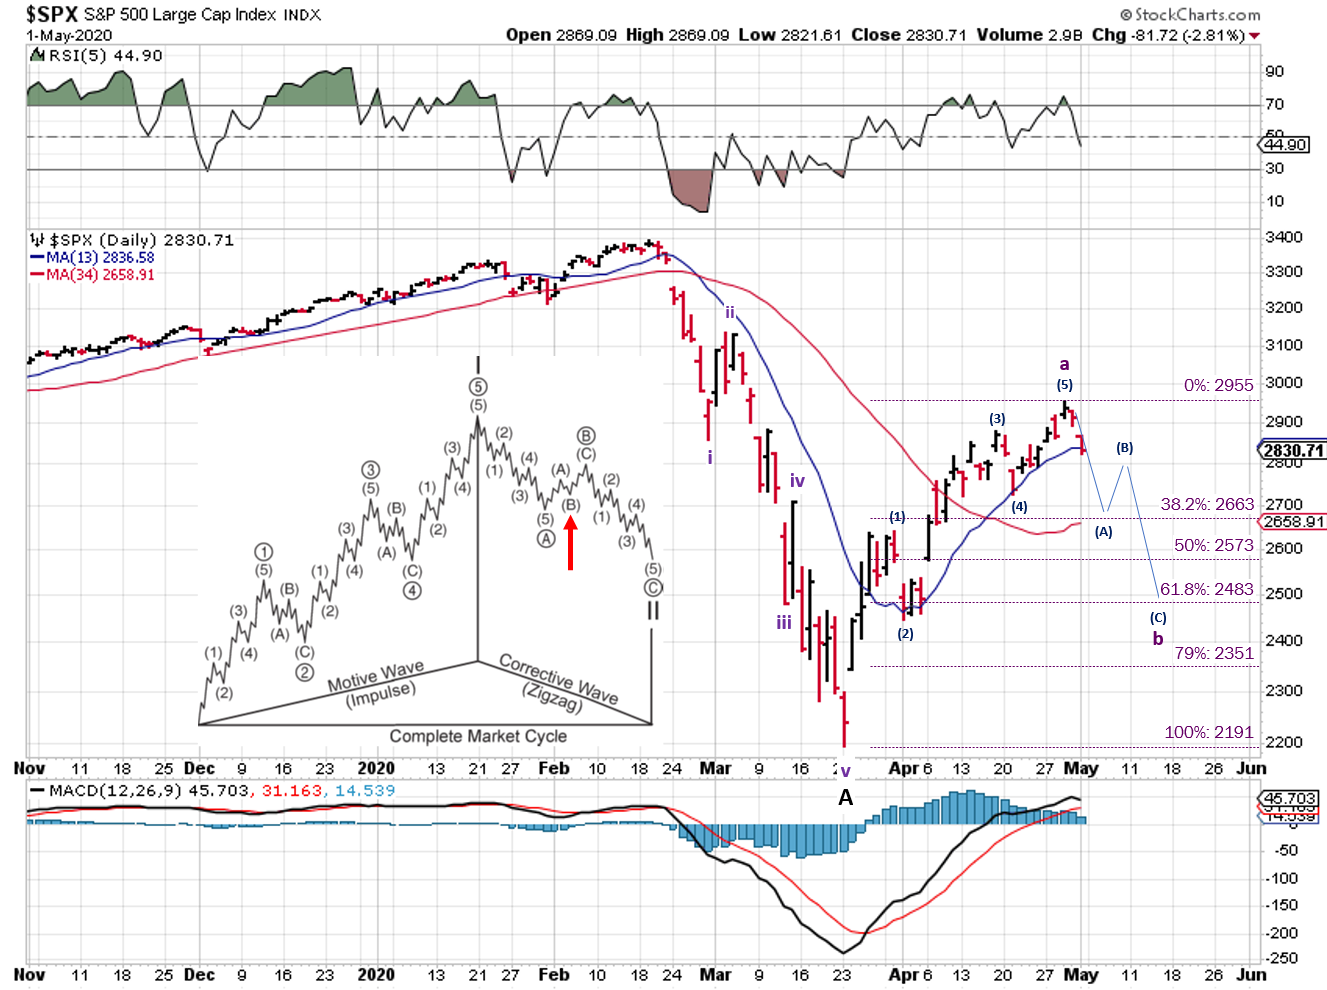
Current Elliott Wave count for S&P500And now that the waves and counts are fixed, we can see that we haven’t completed the a-wave of the large B-wave counterrally.

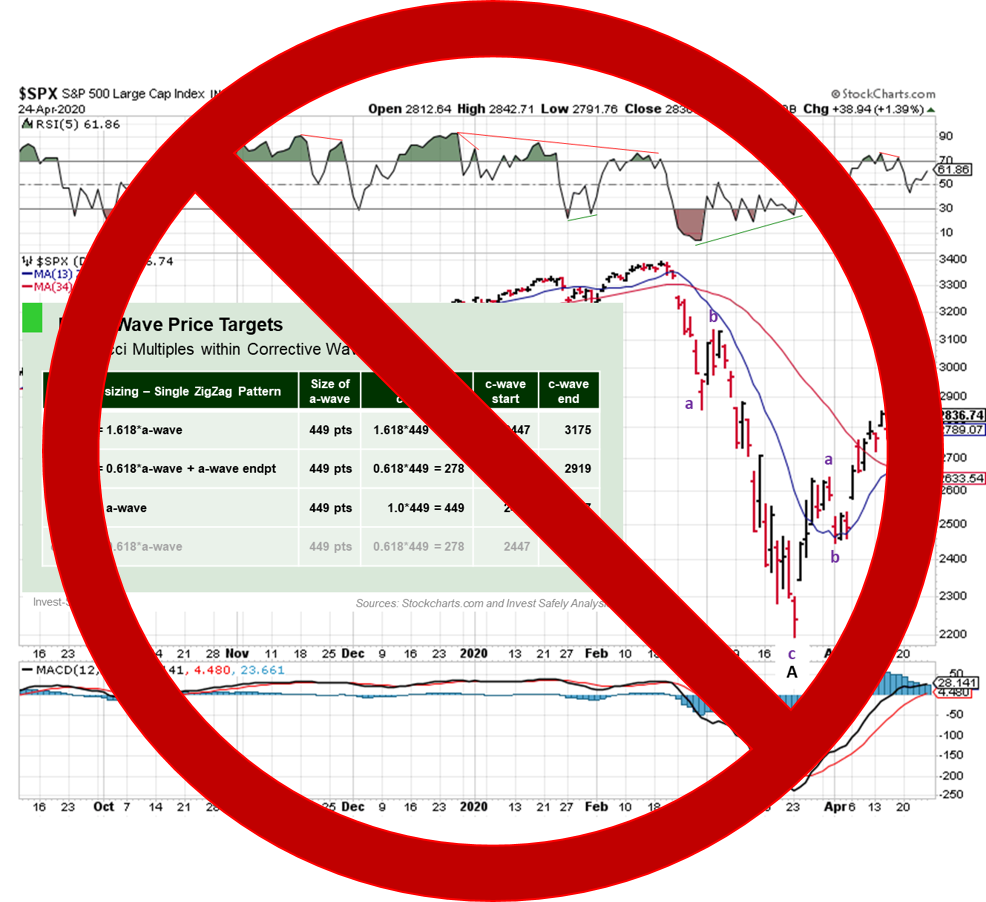
Which also means that the price targets I’ve mentioned for the past few weeks are wrong, since they were all based on the a & b waves being complete.

So now need to go back a step for potential targets.

I’ve been showing the overall retracement levels of the entire downtrend (A-Wave), and those are still valid.

Typical retracements for a B-Wave are 50-79% of the A-Wave.

The A-Wave started at 3393 and ended at 2191 for a total move of 1202 points.

  • 50% = 601 = 2792
  • 79% = 949.5 = 3140

These changes also mean that the Elliott Wave signal is in an uptrend, and has been since market open on April 7.  That’s the same day the ADX switched over, so no changes in when the market outlook switched from a downtrend to an uptrend…we just would have seen all three signals green on the 7th, rather than just 2 of 3.

Best to Your Week!

 

Posted in Historical Data, Market Trends | Tagged , , , , | Comments Off on Mid-week Update for the S&P500

Weekend Stock Market Outlook

Stock Market Outlook entering the Week of April 26th = Uptrend

    • ADX Directional Indicators: Uptrend
    • Price & Volume Action: Uptrend
    • Elliott Wave Analysis: Downtrend

COMMENTARY
The stock market outlook remains in an uptrend to start the week. The ADX and price/volume signals are bullish, while Elliott Wave still indicates a downtrend.

Technical analysis of daily SPX prices

2020-04-26 – SPX Trendline Analysis – Daily

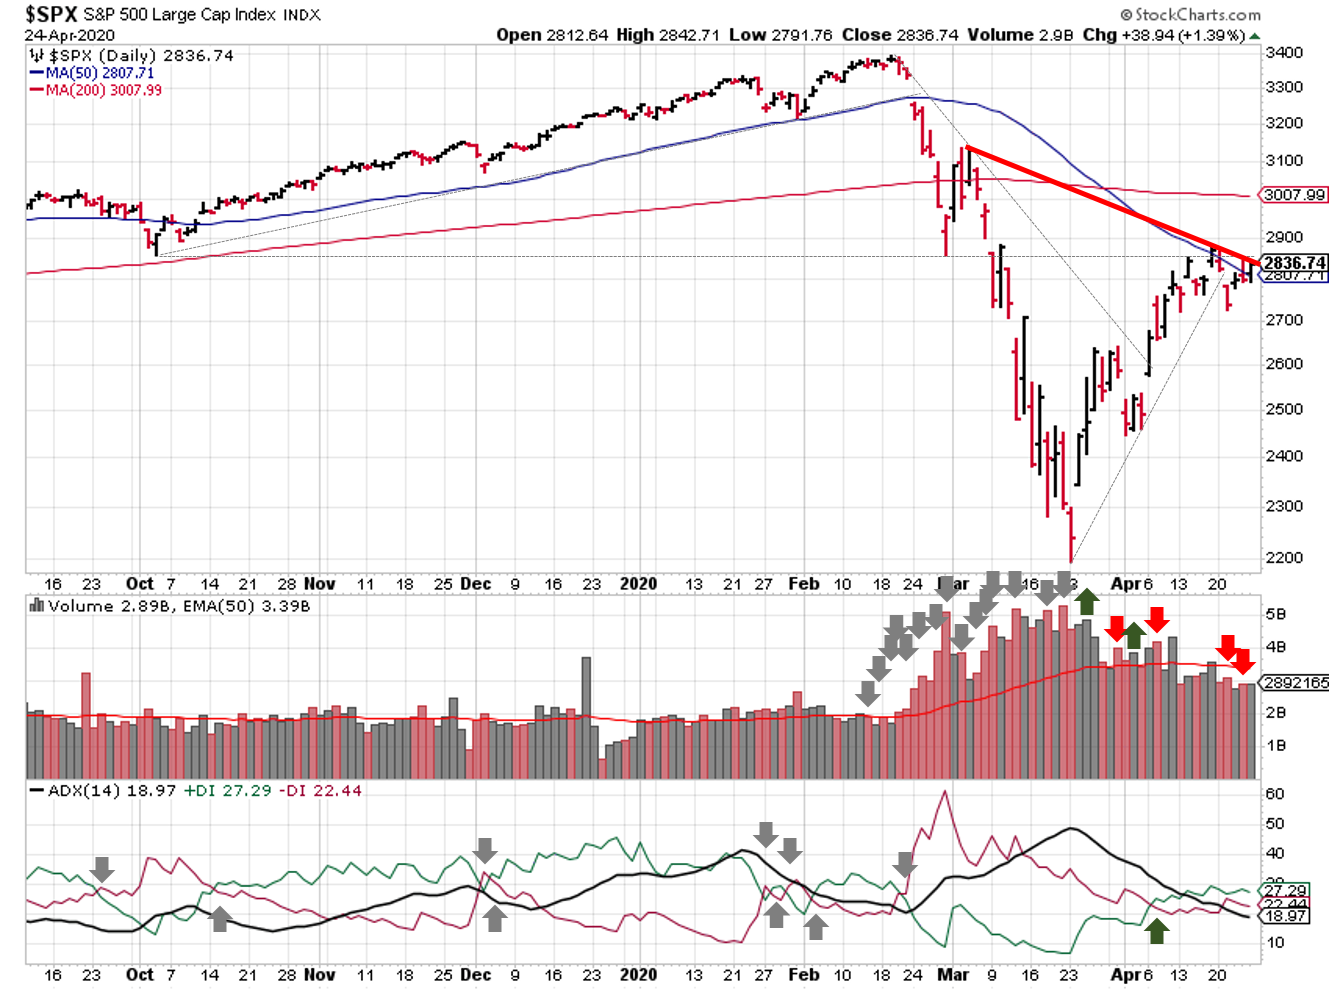
The S&P500 ($SPX) rode the 50-day moving average last week, and starts this week just above that level. The distance between the ADX directional indicators is small, so even a small decline could be enough to change that signal. That said, the overall ADX is below 25, so any trend is really weak.

The current rally only has two distribution days (weak ones because trading volume was below average), so I don’t expect that signal to switch over unless we see massive selling this week.

Price broke the upward trendline on the 20th, so we now have a new downward trendline from the March high as resistance.

Technical analysis of daily SPX prices

2020-04-26 – SPX Elliott Wave Analysis – Daily

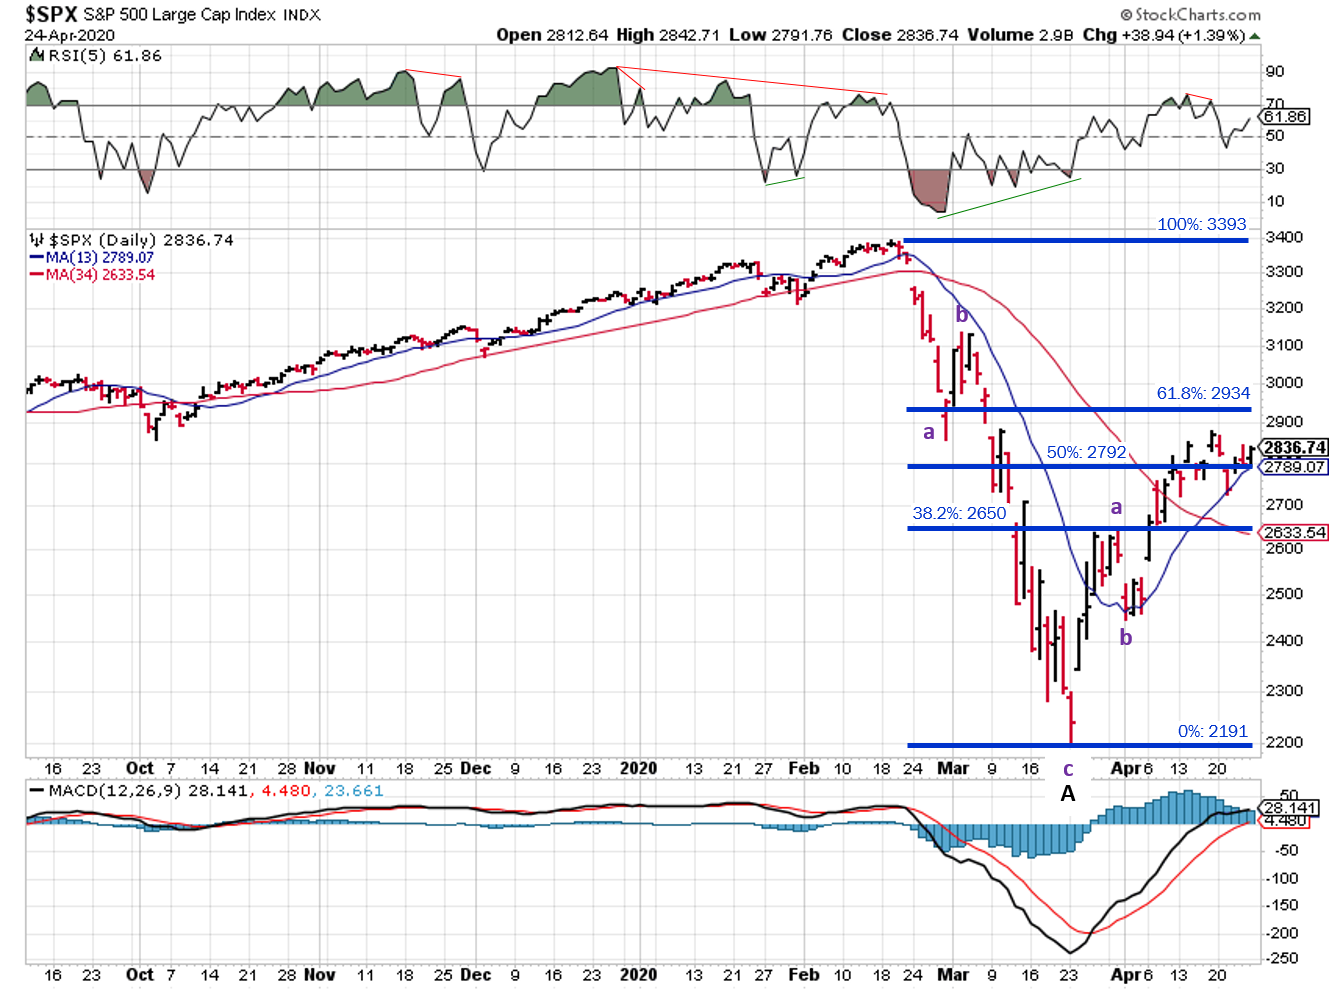
For Elliott wave, the S&P500 continues to fight the 50% retracement level (~2792).  From a wave count perspective, we’re still in the final leg (c-wave) of the current counter-rally (B wave), for those of us who assume we’re in a bear market.

Price reached a high of 2879 two weeks ago; coupled with the decline in RSI, some traders think the B-wave, counter-rally has ended. For now, the 2897, 2919, and 3175 price targets remain in place. I’m also watching 2725. Falling below that price level confirms the end of the B-wave, and the beginning of the next leg down (C-Wave).

Technical analysis of daily SPX prices

2020-04-26 – SPX Elliott Wave Analysis – Daily – Part 2

Oil prices were the story of the week, with the price for May oil futures going negative for the first time ever. Basically, a negative price means that people trying to sell oil had to pay someone to take it off their hands; the markets version of “I wouldn’t buy that unless you paid me”.

The U.S. government signed another coronavirus relief bill, aimed at replenishing the Paycheck Protection Program, which seemed to calm the markets somewhat. The first Paycheck Protection Program allocated $350 billion to help business owners secure low-interest loans, but the funds ran out within 2 weeks. In the meantime, initial jobless claims rose another 4.4 million last week, meaning at least 26 million people have filed for unemployment in the last 5 weeks. Regardless of the recent rally on Wall Street, getting everyone from Main Street back to work is going to take a while.

Earnings season is in full swing, with many big names reporting this week. Expect price volatility and limited forward guidance. The best you can do is look for companies with strong balance sheets and high demand for their products in a “stay at home” economy.

Best to your week!

Posted in Historical Data, Market Trends | Tagged , , , , | 2 Comments

Weekend Stock Market Outlook

Stock Market Outlook entering the Week of April 19th = Uptrend

    • ADX Directional Indicators: Uptrend
    • Price & Volume Action: Uptrend
    • Elliott Wave Analysis: Downtrend

COMMENTARY
The stock market outlook remains in an uptrend to start the week. The ADX and price/volume signals are bullish, while Elliott Wave still indicates a downtrend.

Technical analysis of daily SPX prices

2020-04-19 – SPX Trendline Analysis – Daily

The S&P500 ($SPX) sits just above the 50-day moving average, and the current rally only has two distribution days.

Technical analysis of daily SPX prices

2020-04-19 – SPX Elliott Wave Analysis – Daily

For Elliott wave, the S&P500 remains in the final leg (c-wave) of the current rally (B wave). Note the negative divergence between the relative strength (RSI) and price over the past few days. Last week’s price targets for ending the c-wave are still in play: 2897, 2919, and 3175.

Technical analysis of weekly SPX prices

2020-04-19 – SPX Trendline Analysis – Weekly

~22 million Americans have filed for unemployment benefits in the past 4 weeks, erasing all the new jobs gained since the bull market began in March of 2009. In my home state of Michigan, some estimates put unemployment near 25%!

There’s been a lot of talk about the “shape” of the recovery; will prices trace out a V-shape, U-shape, or L-shape.  Right now, it looks like a V-shape, but I don’t think that will last much longer.  One reason I think we’ll see a U or L shape is due to corporate debt.  With quarantines and lock downs in place, people aren’t making or spending money.  Companies are generating a lot less revenue, and if they want to see the other side of the crisis, they need to use debt to cover costs until their customers return.

The problem is that many companies have already been using debt to cover their costs, even before the pandemic.  You may have heard people refer to “zombie” companies; a “zombie” company is:

  • A publicly traded firm
  • 10+ years old
  • Ratio of “earnings before interest and taxes” (EBIT) to interest expenses is less than 1

If EBIT divided by interest expense is less than 1, this means that the company doesn’t make enough money to cover the interest it has to pay out. In the U.S., 16% of publicly traded companies fall into this category. Nearly a third of the companies in the Russell 2000 Index are zombie companies! (Hat tip to On My Radar by Steve Blumenthal).

One reason we have so many zombie companies in the U.S. is the fact that interest rates have remained very low for a long time. Instead of going out of business, or restructuring via bankruptcy, poor performing firms could take out more debt and kick the can down the road, so to speak.  We’ve caught up to the can.

Best to your week!

Posted in Historical Data, Market Trends | Tagged , , , , | Comments Off on Weekend Stock Market Outlook

Weekend Stock Market Outlook

Stock Market Outlook entering the Week of April 12th = Uptrend

    • ADX Directional Indicators: Uptrend
    • Price & Volume Action: Uptrend
    • Elliott Wave Analysis: Downtrend

COMMENTARY
The stock market outlook switched to an uptrend last week!  The ADX directional indicators crossed over based on Tuesday’s price movement, meaning two of the three signals tracked for the weekend outlook are now showing an uptrend.

Technical analysis of daily SPX prices

2020-04-12 – SPX Trendline Analysis – Daily

The S&P500 ($SPX) broke through the downward trendline on Monday, and you can lay in a new upward trendline off the lows.  We start this week ~7% above that trendline, so keep that in mind if you’re using that for a trigger.  It seems like a lot, but in our current trading environment, 7% is a day or two of price action.

Technical analysis of daily SPX prices

2020-04-12 – SPX Elliott Wave Analysis – Daily

For Elliott wave, the S&P500 has retraced 50% of the correction, and is in the final leg (c-wave) of the current rally (B wave).  Based on a zig-zag pattern, price targets for the end of the current wave are 2897, 2919, and 3175.  The first support level from the initial downtrend (2855) could provide resistance, as well as the 50-day moving average (2909) and the 61.8% retracement level (2934).

Technical analysis of weekly SPX prices

2020-04-12 – SPX Trendline Analysis – Weekly

We saw some positive signs, with regard to infection curves, showing that social distancing and shutdowns are slowing the spread. That said, slowing the spread isn’t the same as a therapeutic treatment or vaccine, and both will be needed to really create a “normal” environment. And even then, restarting the economy isn’t as easy as flipping a switch.

~17 million Americans have filed for unemployment benefits in the last three weeks…that’s about 10% of the workforce! Many people are STILL trying to access there state’s websites or call centers. That total doesn’t include employees who are experiencing reduced income via pay cuts and furloughs. Budgets are being stretched and savings are being drained. It’ll take some time before those holes are filled and consumer spending habits change.

The EU reached an agreement on a 500b Euro package to kickstart economic growth. Details on who will pay are TBD.

The Fed announced even more stimulus, including $600 billion in new loans for small and medium sized businesses, $850 billion in corporate lending programs, and $500 billion to states and municipalities.

They will also, via the US Treasury, will fund the purchases of some types of high-yield bonds, collateralized loan obligations and commercial mortgage-backed securities, as well as ETFs that track investment grade and speculative debt. Yes, the Fed is buying bond ETFs. And who knows…another leg down and they could even announce purchases of equity ETFs!

If you’ve made money trading the recent bounce/rally, don’t get greedy and forget to take profits.  Some sectors have rebounded better than others, so take a look at your asset allocation overall and make sure you’re happy with your risk levels.  And as always, make sure you’ve updated your sell signals, so that if we do see stock prices fall  you’re not stuck with even bigger losses.

Banks kick off Q1 earnings season this week. Keep an eye on forecasts for the year, or lack thereof.

Best to your week!

Posted in Historical Data, Market Trends | Tagged , , , , | Comments Off on Weekend Stock Market Outlook

Mid-week Update for the S&P500

A couple of chart updates based on this week’s price action.

2020-04-08 – SPX Trendline Analysis – Daily

The S&P500 ($SPX) broke through the downward trendline on Monday, so you can lay in a new upward trendline off the low prices. The ADX directional indicators also crossed over based on Tuesday’s price movement, meaning two of the three signals tracked for the weekend outlook are now showing an uptrend.

2020-04-08 – SPX Elliott Wave Analysis – Daily

For Elliott wave , the SPX is in the final leg of the current rally (the c-wave of the larger B wave).  Once this wave completes, the S&P is expected to resume the correction.

Tuesday’s price action left a lot to be desired, gapping up to open trading and then selling off throughout the day.  A good reminder to watch out for head-fakes; volatility is still really high.

Best to your week!

Posted in Historical Data, Market Trends | Tagged , , , , | Comments Off on Mid-week Update for the S&P500

Market Insights from JP Morgan for 2020 Q2

Each quarter, JP Morgan Asset Management provides a ton of useful information via its “Guide to the Markets”:

“a comprehensive array of market and economic histories, trends and statistics through clear, compelling charts and graphs you can share with your clients.”

You can find this little gem on JP Morgan’s Asset management website, including the “Guide to the Markets” PDF and audio commentary.  Topics include Equities, Fixed Income, International markets, the U.S. economy, as well as alternative investments and investor behavior.

historical market performance

Source: JP Morgan Asset Management – 2020 Q2 – Slide 16


Source (PDF): JP Morgan Guide to the Markets: Q2 2020

Posted in Current Events, Historical Data, Investing, Market Trends, Uncategorized | Tagged , , , , , , , | Comments Off on Market Insights from JP Morgan for 2020 Q2

Weekend Stock Market Outlook

Stock Market Outlook entering the Week of April 5th = Downtrend

    • ADX Directional Indicators: Downtrend
    • Price & Volume Action: Uptrend
    • Elliott Wave Analysis: Downtrend

COMMENTARY
The stock market outlook remains in a downtrend; no change in the ADX or Elliott Wave. The price/volume indicator switched to an uptrend. Yes, you read that correctly; an uptrend!

Technical analysis of daily SPX prices

2020-04-05 – SPX Trendline Analysis – Daily

The S&P500 ($SPX) is well below it’s moving averages (~19 and 21% below the 50 and 200 day, respectively). Since those gaps are significant, neither indicator will be helpful in determining the near-term outlook.

Prices also retreated from the current downward trendline, but may have found support for a new uptrend at the 2450 level.  One of those trendlines will be violated soon, as both are really steep and daily price moves are still big.

The ADX directional indicators show a weakening trend, but it’s not done just yet.  On Thursday, we saw a follow-through day in the SPX. Before you get your hopes up, remember that severe market corrections like this one aren’t kind to the first rally attempt; most fail.

Elliott Wave analysis of daily SPX prices

2020-04-05 – SPX Elliott Wave Analysis – Daily

According to most Elliott wave counts, the SPX is experiencing a short-term rally in a longer-term downtrend; meaning 2191 isn’t the bottom.  That said, we could rally to 2934 before heading back down!

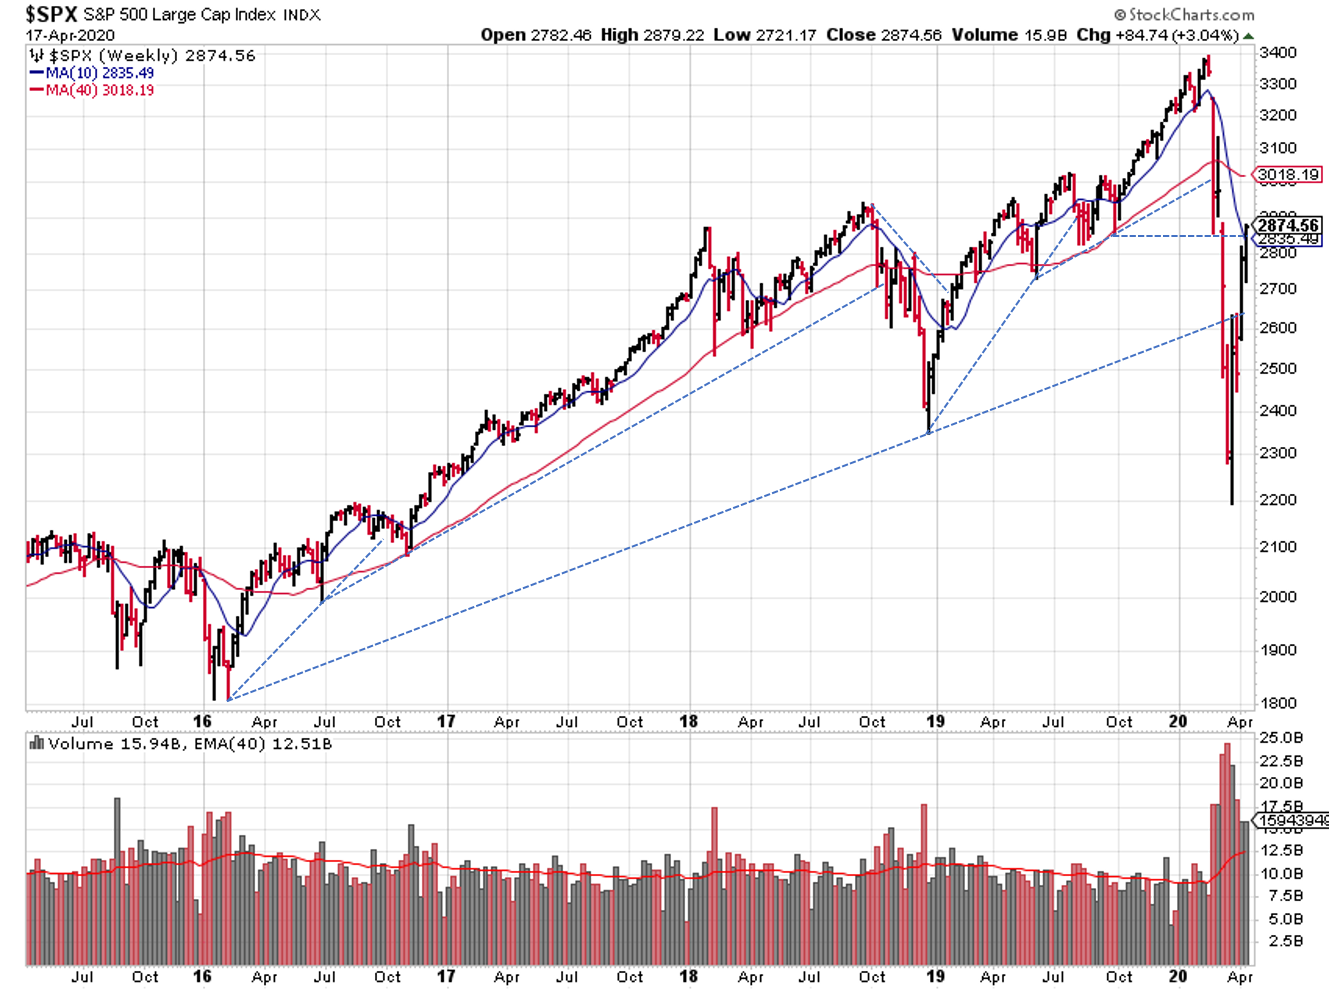
If we look at the weekly chart, we can see that prices met resistance at the Feb 2016- Dec 2018 trendline for the past two weeks. 2 points for the bear market.

Technical analysis of weekly SPX prices

2020-04-05 – SPX Trendline Analysis – Weekly

The big move last week occurred in commodities, with oil price surging 32% on news that the U.S. was trying to coordinate a global effort to reduce output and stabilize prices. That action doesn’t really jive with “free market” principles…but “misery (along with politics) acquaints a man with strange bedfellows”.

~10 million Americans filed for unemployment benefits in the last two weeks and they are just the ones that were able file. Many people are still trying to access there state’s websites or call centers.

Q1 earnings reports are starting to trickle in as well; expect results to be a mixed bag. The first half of the quarter was “only” impacted by a shut-down in China, so some firms were still doing okay.  Things hit the fan, so to speak, in the back half of Q1.

Stay safe, stay home as much as you can, and best to your week!

Posted in Historical Data, Market Trends | Tagged , , , , | Comments Off on Weekend Stock Market Outlook