Stock Market Outlook entering the Week of September 25th = Downtrend
-
- ADX Directional Indicators: Downtrend
- Price & Volume Action: Downtrend
- Elliott Wave Analysis: Downtrend
ANALYSIS
The stock market outlook remains in a downtrend heading into the final week of the 3rd quarter.
The S&P500 ($SPX) fell 4.6% last week, pressured by hawkish monetary policy around the globe. The index currently sits 8.5% below the 50-day, and ~13% below the 200-day moving average.

SPX Price & Volume Chart for the Week of September 25 2022
All three indicators are bearish, with clusters of distribution days clearly showing institutional selling since the end of August.

SPX Elliott Wave Analysis for the Week of September 25 2022
COMMENTARY
The U.S. Fed raised interest rates 0.75% this week. Judging from the sell-off that following, a majority of market participants may have finally accepted the Fed isn’t planning to lower rates any time soon. Several investment banks even lowered their year-end targets for the SPX.
Increasing rates and asset class sell-offs aren’t a U.S.-only phenomenon. Central banks across the globe are raising rates to fight off inflation while seeing their stock markets drop. The new U.K. government went as far as announcing a stimulus plan, and no one like that either! Because, you know, inflation.
U.S. housing data was mixed. A continued slide in sales was offset by declining prices and an unexpected jump in housing starts (year over year).
The set-up for this week is definitely volatility!
Professional money managers and hedge funds face another quarter of sub-par returns, so they might try to engineer last minute profits and/or reduce losses. We’re due for some kind of bounce after last week’s sell-off, and a lot can be done with options these days.
Unfortunately, companies that have held up well, like Apple, could be sold into any rally specifically because they’ve held up well. If you want to lock in gains, you have to sell investments that still have them…just like everyone else. And if stocks with high market capitalization, like Apple, are sold off, market-weighted indexes like the S&P500 also sell off.
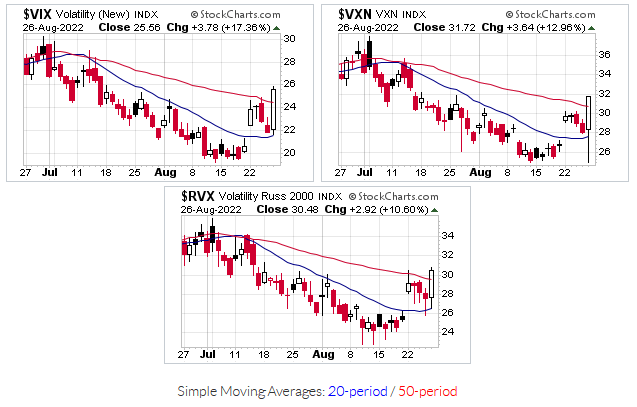
The VIX sits just below 30, above which is the level that stocks become uninvestable (or “F” bucket those of you that work with Hedgeye). So even if we do get a month end rally, it’s not the time to be putting money into stocks.
With rates rising, bond volatility is also elevated (^MOVE – Bank of America’s Bond Volatility Index is above 110 or so), so bonds aren’t the place to be either.
Cash is the safest place, specifically the U.S. dollar.
Best To Your Week!
P.S. If you find this research helpful, please tell a friend. If you don’t, tell an enemy.