Weekend Stock Market Outlook – May 26 2024

Stock Market Outlook entering the Week of May 26th = Uptrend

  • ADX Directional Indicators: Uptrend
  • Price & Volume Signals: Uptrend
  • On Balance Volume Indicator: Uptrend

ANALYSIS
The stock market outlook remains in an uptrend, heading into a holiday shortened trading week.

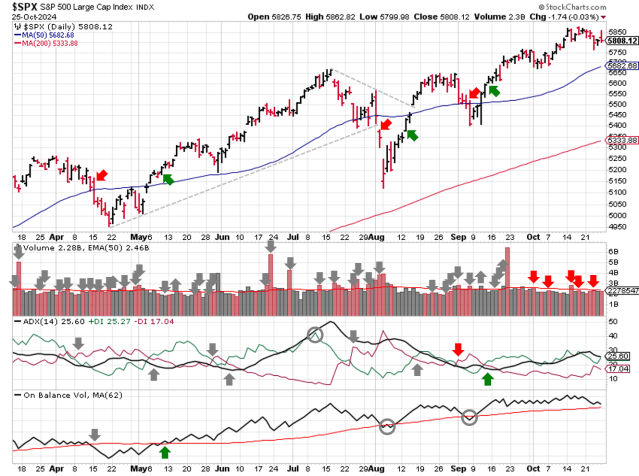
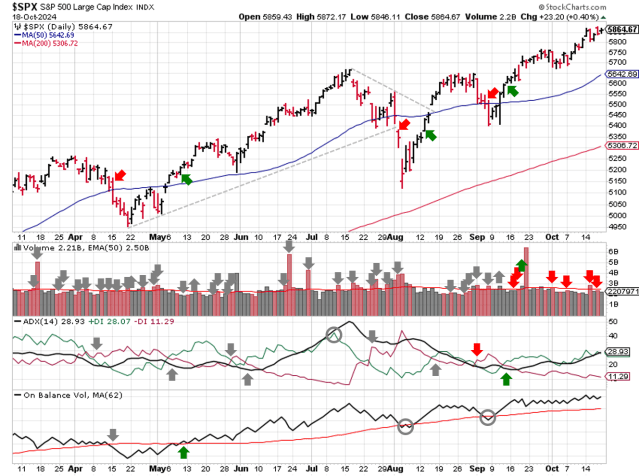
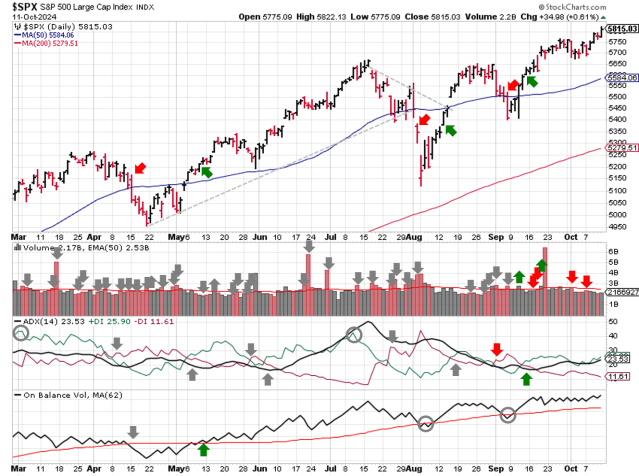
The S&P500 ($SPX) was flat last week.  The index closed ~3% above the 50-day moving average and ~12% above the 200-day moving average.

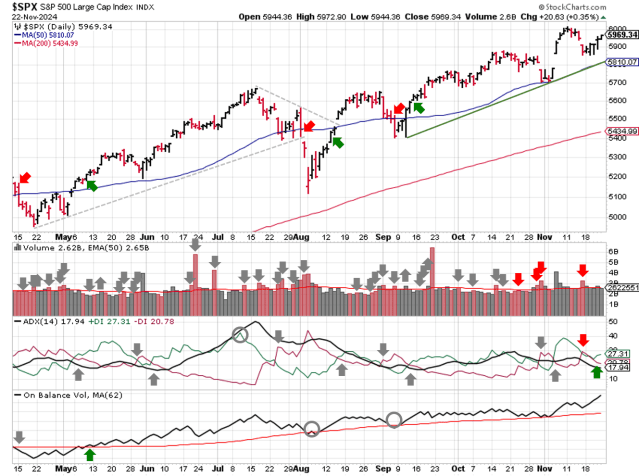
Technical analysis of daily SPX prices

SPX Price & Volume Chart for the Week of May 26 2024

All three signals (ADX, Price/Volume, and On-Balance Volume) ended the week in bullish territory. The index did pick up 2 distribution days. Given the “late” follow-though that erased a stalling day, the current rally is off to a weak start.

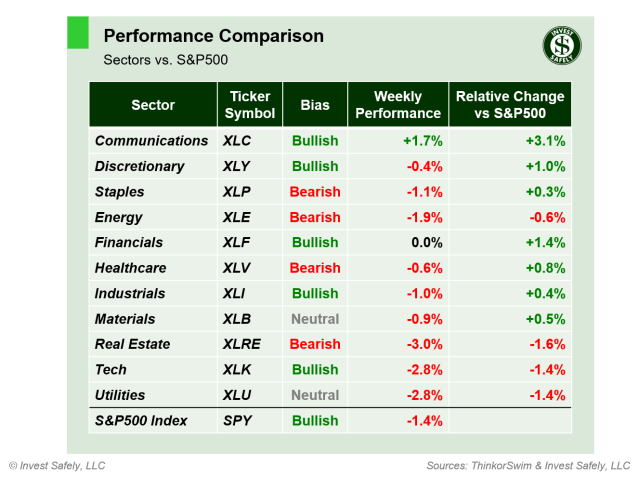
Weekly price performance of S&P500 sector ETFs

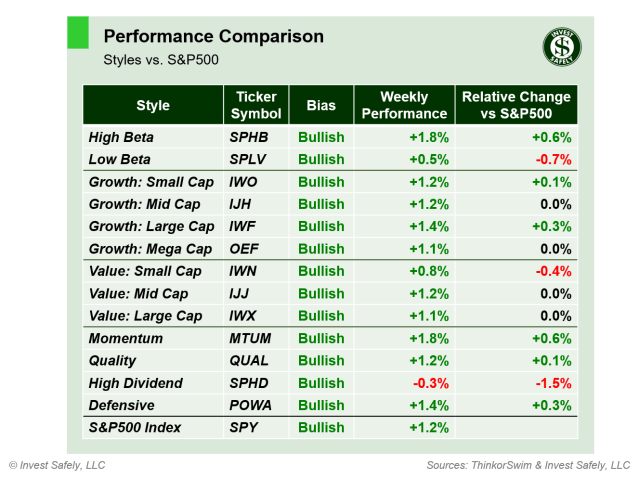
S&P Sector Performance for Week 21 of 2024

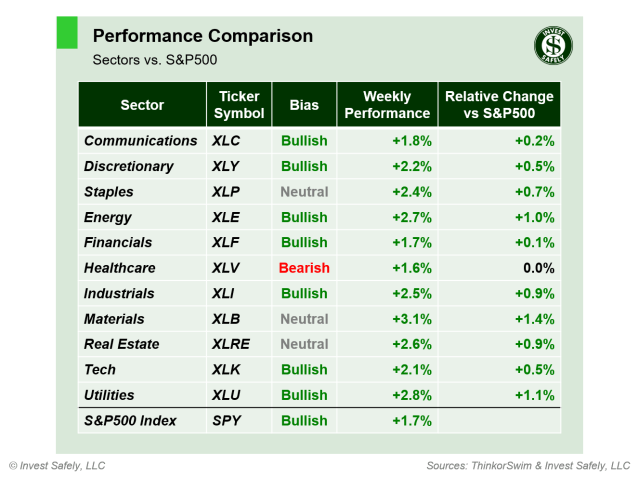
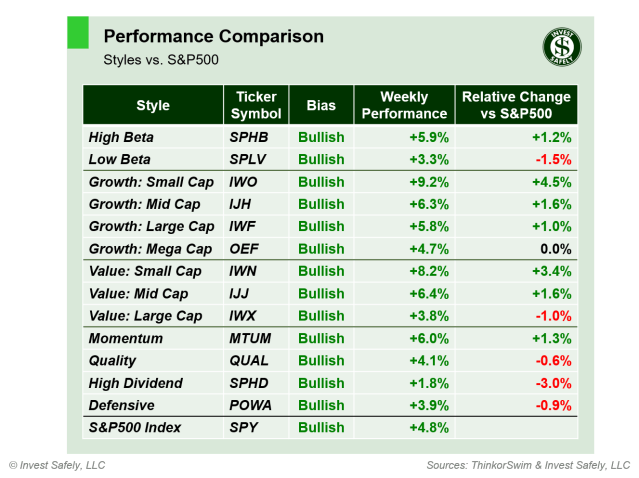
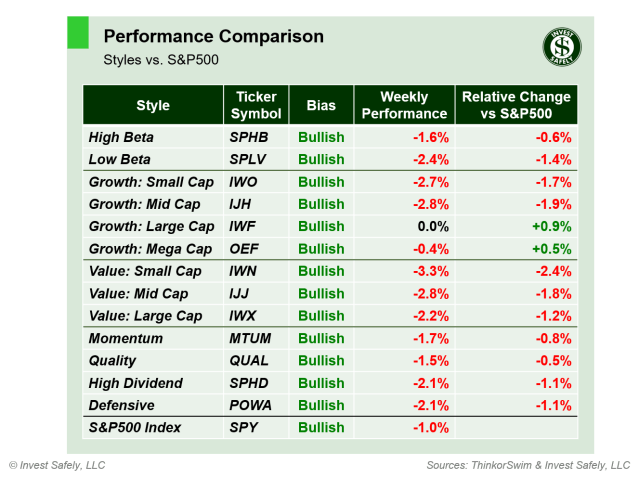
Under the hood, most S&P500 sub-sectors were losers last week.  Technology ($XLK) and Communications ($XLC) were the only gains, thanks to their inclusion of Mag 7 stocks.  Energy ($XLE) and Real Estate ($XLRE) were the worst sectors, each dropping more than 3%.

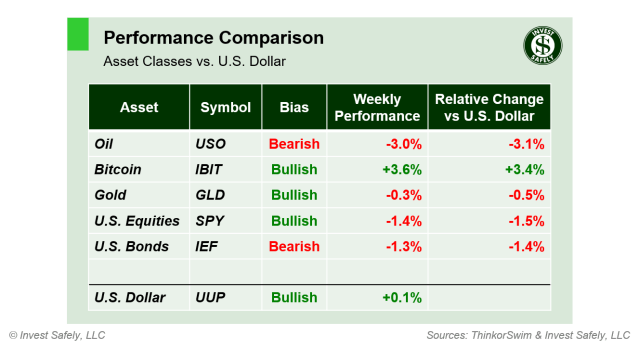
Weekly price performance by asset class

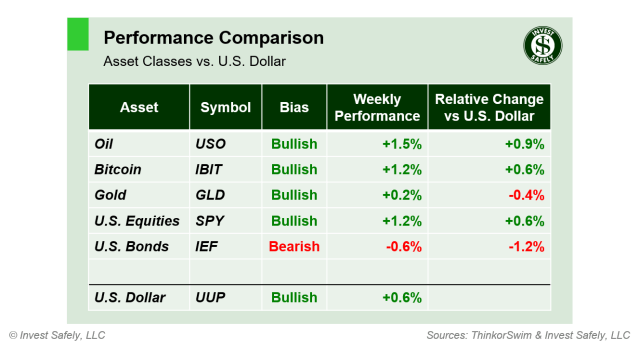
Asset Class Performance for Week 21 of 2024

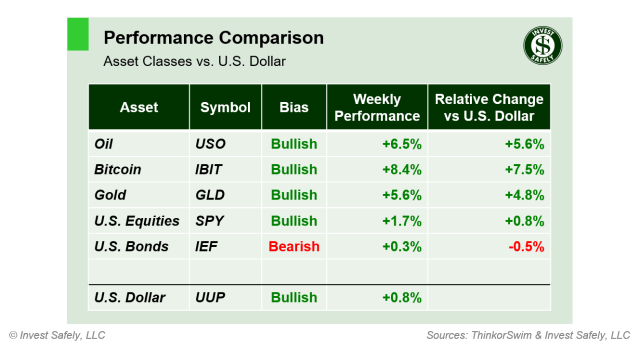
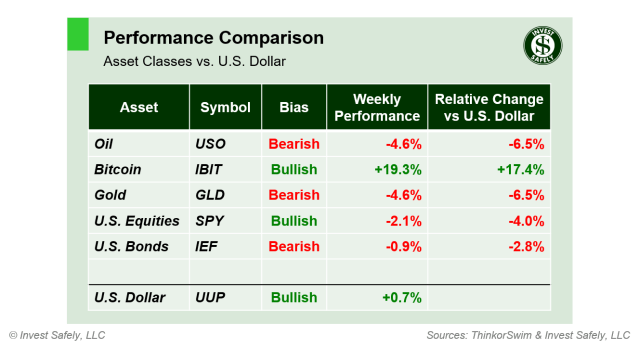
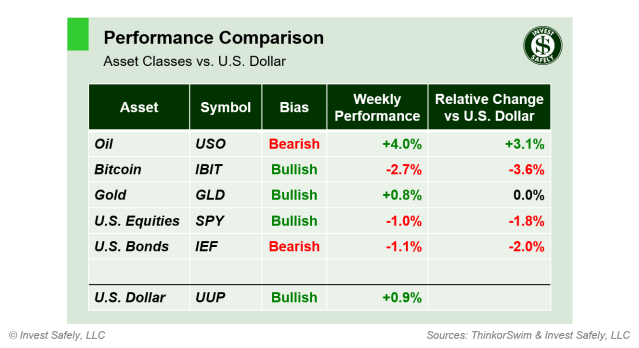
Equities weren’t the only asset class to struggle, as gold dropped more than 3%, joining energy and real estate sectors. Bitcoin led the way again, rising another 3%.

COMMENTARY
Nvidia ($NVDA) stole the show last week, beating earnings estimates once again, and breaching the psychological $1,000/share mark. The company also announced a 10 to 1 stock split, which will lower the price of shares and options. The market needed a strong performance from this heavyweight to stay close to even on the day, since ~80% of the S&P sold off.

FOMC minutes showed that participants aren’t convinced interest rates are restrictive, given the recent string of higher than expected inflation readings. And Fed Fund Futures responded by pushing timing for the first-rate cut into November…that’s a far cry from the 6 rate cuts projected just a few short months ago.

U.S. markets are closed tomorrow (Monday) in observance of Memorial Day, so a short trading week ahead.  The U.S. Bureau of Economic Analysis releases the second Q2 GDP estimate on Thursday, and the latest PCE data comes out Friday pre-market.

Best to Your Week!

P.S. If you find this research helpful, please tell a friend.
If you don’t, tell an enemy.

Sources: Bloomberg, CNBC, Federal Reserve Bank of St. Louis, Hedgeye, Stockcharts.com, U.S. Bureau of Economic Analysis, U.S. Bureau of Labor Statistics

Invest Safely, LLC is an independent investment research and online financial media company.  Use of Invest Safely, LLC and any other products available through invest-safely.com is subject to our Terms of Service and Privacy Policy.
Not a recommendation to buy or sell any security.
Posted in Historical Data, Market Trends | Tagged , , , | Comments Off on Weekend Stock Market Outlook – May 26 2024

Weekend Stock Market Outlook – May 19 2024

Stock Market Outlook entering the Week of May 19th = Uptrend

  • ADX Directional Indicators: Uptrend
  • Price & Volume Signals: Uptrend
  • On Balance Volume Indicator: Uptrend

ANALYSIS
The stock market outlook starts the week in an uptrend, with the index just shy of an all time high, thanks to April CPI data.

The S&P500 ($SPX) rose 1.5% last week and now sits above the 50 and 200-day moving averages (~3% and ~12% respectively).

Technical analysis of daily SPX prices

SPX Price & Volume Chart for the Week of May 19 2024

The ADX and OBV signals are bullish heading into the week, showing buyers remained more aggressive than sellers last week. Price/volume shifted to an uptrend on Wednesday, after the SPX responded to dovish CPI data with a follow-through day. The move also resets the distribution day count.

Weekly price performance of S&P500 sector ETFs

S&P Sector Performance for Week 20 of 2024

Most sub-sectors of the S&P500 were green on an absolute basis, but most of those gains were generated by the general index.  Technology ($XLK) lead the way last week, while Industrials ($XLI) were the worst performer.

From an asset perspective, a weak dollar benefited all classes. The risk-on reaction to a dovish CPI print sent the price of Bitcoin almost 11% higher for the week, breaking out of the recent consolidation pattern.

Weekly price performance by asset class

Asset Class Performance for Week 20 of 2024

COMMENTARY
The “big news” last week was the return of the “RoaringKitty” X.com/Twitter account.  After radio silence since June 17 2021, a cryptic meme appeared Sunday:

This image was all it took to ignite a frenzy of social media speculation about a potential short squeeze in Gamestop ($GME), the ticker that made Keith Gill a household name.  Which, of course, led to a massive level of trading in several meme stocks prior to the market opening on Monday, as well as the rest the week.

Unsurprisingly, there was no “real” news driving the move, and the tickers gave back a majority of their gains.  There’s even some who claim that Mr. Gill sold the “RoaringKitty” account, calling into question who is posting and for what purpose (other than your classic pump and dump).  Just another reminder to be careful when you’re on the internet.

In other news, Federal Reserve Chairman Jerome Powell participated at the Foreign Bankers’ Association’s Annual General Meeting in Amsterdam, reiterating the stance that inflation remains sticky, but the U.S. economy is still performing well based on GDP growth, tight labor markets, and solid household finances.

His remarks came after the pre-market release Producer Price Indexes, which showed Headline and Core inflation accelerated in April. Market reaction was muted, likely due to the fact that the increases were in line with expectations.

PPI (y/y) Actual Prior Expected
Headline +2.2% +1.8%* +2.2%
Core +2.4% +2.1%* +2.4%

*March Headline PPI was revised down to 1.8% from 2.1%; Core PPI to 2.1% from 2.4%

On Wednesday, the BLS released April CPI data, showing that Core and Headline figures eased slightly in April. Market reaction was bullish on renewed expectations for interest rate cuts.

CPI(y/y) Actual Prior Expected
Headline +3.4% +3.5% +3.4%
Core +3.6% +3.8% +3.6%

This week kicks off with a Sunday speech from five (!) speeches from Federal Reserve officials; one Sunday afternoon from Chairman Powell, and 4 Monday morning from Bostic, Barr, Waller, and Jefferson.  Then Tuesday is more of the same, with eight (!!) more speeches!

FOMC minutes from the last meeting get dissected Wednesday afternoon, and Durable Goods Orders for April hit the wires on Friday.

Best to Your Week!

P.S. If you find this research helpful, please tell a friend.
If you don’t, tell an enemy.

Sources: Bloomberg, CNBC, Federal Reserve Bank of St. Louis, Hedgeye, Stockcharts.com, U.S. Bureau of Economic Analysis, U.S. Bureau of Labor Statistics

Invest Safely, LLC is an independent investment research and online financial media company.  Use of Invest Safely, LLC and any other products available through invest-safely.com is subject to our Terms of Service and Privacy Policy.
Not a recommendation to buy or sell any security.
Posted in Historical Data, Market Trends | Tagged , , , | Comments Off on Weekend Stock Market Outlook – May 19 2024

Weekend Stock Market Outlook – May 12 2024

Stock Market Outlook entering the Week of May 12th = Uptrend

  • ADX Directional Indicators: Uptrend
  • Price & Volume Signals: Mixed
  • On Balance Volume Indicator: Uptrend

ANALYSIS
The stock market outlook shift back to an uptrend with two of the three signals in bullish territory.

The S&P500 ($SPX) rose 1.9% last week and now sits above the 50 and 200-day moving averages (~2% and ~11% respectively).

Technical analysis of daily SPX prices

SPX Price & Volume Chart for the Week of May 12 2024

The ADX signal flipped back to bullish on Tuesday, followed by the On Balance Volume indicator on Friday.  The combination shifted the outlook back to an uptrend.

Price volume shifts to mixed.  Though the index continued higher last week, none of the up days have come with the necessary trading volume.   Notice the similar trend in trading volume at the start of the last rally in early November (below average/declining while prices rise).  This time, the 11 day window has passed, so caution is warranted.

Friday’s session also qualified as a “stalling day”, highlighting under-the-radar selling pressure.  A stalling day occurs when trading volume is ~95% or more of the previous session, but there’s little to no price increase. It’s an easily overlooked type of distribution day because price doesn’t drop.

Weekly price performance of S&P500 sector ETFs

S&P Sector Performance for Week 19 of 2024

All sub-sectors of the S&P500 were green last week, with Utilities ($XLU) leading the way for a second week in a row.  Consumer Discretionary ($XLY) was essentially flat for the week, thanks in large part to Amazon ($AMZN).

Gold returned to the winners circle last week, outpacing most asset classes by a wide margin, while Bitcoin continued its recent correction.

Weekly price performance by asset class

Asset Class Performance for Week 19 of 2024

COMMENTARY
~90% of the S&P500 have reported Q1 results; earnings are on pace to grow roughly 6% year over year.

Next week, the Bureau of Labor Statistics releases April inflation data (PPI/CPI) and Federal Reserve Chairman Powell speaks at the Foreign Bankers’ Association in Amsterdam.  Monthly option expiration on Friday as well.

Best to Your Week!

P.S. If you find this research helpful, please tell a friend.
If you don’t, tell an enemy.

Sources: Bloomberg, CNBC, Federal Reserve Bank of St. Louis, Hedgeye, Stockcharts.com, U.S. Bureau of Economic Analysis, U.S. Bureau of Labor Statistics

Invest Safely, LLC is an independent investment research and online financial media company.  Use of Invest Safely, LLC and any other products available through invest-safely.com is subject to our Terms of Service and Privacy Policy.
Not a recommendation to buy or sell any security.
Posted in Historical Data, Market Trends | Tagged , , , | Comments Off on Weekend Stock Market Outlook – May 12 2024

Weekend Stock Market Outlook – May 5 2024

Stock Market Outlook entering the Week of May 5th = Downtrend

  • ADX Directional Indicators: Downtrend
  • Price & Volume Signals: Downtrend
  • On Balance Volume Indicator: Downtrend

ANALYSIS
The stock market outlook remains in a downtrend, starting May in roughly the same position as it ended April.

The S&P500 ($SPX) rose 0.5% last week, reaching the 50-day moving average and sitting ~9% above the 200-day moving average.

Technical analysis of daily SPX prices

SPX Price & Volume Chart for the Week of May 05 2024

The ADX signal is bearish heading into the week, and on-balance volume shows sellers remain in control.

Price/volume remains bearish, despite Friday’s gap higher.  The session met the price increase criteria (+1.25%), but didn’t come with the needed trading volume.  Instead, added volume came in the form of 2 distribution days.

There’s still time for the index to turn things around, but the odds of a robust rally drop further if the market doesn’t follow-through within 11 days (5/7).

Weekly price performance of S&P500 sector ETFs

S&P Sector Performance for Week 18 of 2024

Within U.S. equities, most major sectors were green last week.  Despite all the labor and inflation talk (and Apple earnings), Utilities ($XLU) outperformed the other sectors. Energy ($XLE) struggled again, largely due to the continued weakness in oil.

U.S. bonds were the best asset class last week, while oil dropped almost 7%.

Weekly price performance by asset class

Asset Class Performance for Week 18 of 2024

COMMENTARY
The big news last week was the “Powell Pivot” during the FOMC press conference on Wednesday. Did you miss it?   That’s probably because the committee left rates unchanged, and said that inflation hadn’t come down as much as they had hoped.  Or maybe it was the surprise statement that the Federal Reserve will begin tapering Quantitative Tightening in June.

But the real story was Powell’s remarks related to labor, and the renewed focus on employment, rather than inflation. Technically, the Federal Reserve’s dual mandate mean they equally split their focus between labor and inflation. But job data remained strong (at least according to lagging data sources), giving them cover to focus on inflation. It appears that now, the labor market will play a larger roll in determine the potential for rate cuts.

Markets also cheered Powell’s comments on the potential size and speed of any rate cuts later this year. When asked if he felt like the Federal Reserve was running out of time to get in “enough” rate cuts before year end, Powell flatly dismissed the notion. Fed watchers interpreted that as a willingness by Powell to use larger rate cuts, versus the prior 0.25% increments.

And as if on cue, Non-Farm Payrolls (NFP) came in lower than expected on Friday.  Equities responded by gapping higher, while rates fell.

In other news, last week’s ISM manufacturing and services PMI surprised to the downside, showing a contraction in the April data.

And not to be outdone by the likes of Tesla, Apple ($AAPL) overcame a less than stellar financial results by increasing their dividend and unveiling a massive, $110B buyback program during their earnings announcement. That’s equivalent to the GDP of many small countries!

Best to Your Week!

P.S. If you find this research helpful, please tell a friend.
If you don’t, tell an enemy.

Sources: Bloomberg, CNBC, Federal Reserve Bank of St. Louis, Hedgeye, Stockcharts.com, U.S. Bureau of Economic Analysis, U.S. Bureau of Labor Statistics

Invest Safely, LLC is an independent investment research and online financial media company.  Use of Invest Safely, LLC and any other products available through invest-safely.com is subject to our Terms of Service and Privacy Policy.
Not a recommendation to buy or sell any security.
Posted in Historical Data, Market Trends | Tagged , , , | Comments Off on Weekend Stock Market Outlook – May 5 2024

Weekend Stock Market Outlook – April 28 2024

Stock Market Outlook entering the Week of April 28th = Downtrend

  • ADX Directional Indicators: Downtrend
  • Price & Volume Signals: Downtrend
  • On Balance Volume Indicator: Downtrend

ANALYSIS
The stock market outlook remains in a downtrend, though the SPX looks poised to test that signal this week.

The S&P500 ($SPX) rallied 2.7% last week, and is now just ~0.5% below the 50-day and ~9% above the 200-day moving average.

Technical analysis of daily SPX prices

SPX Price & Volume Chart for the Week of Apr 28 2024

The ADX signal is bearish, but the positive direction indicator was on the rise last week and could crossover with a little more bullish price action.

Price/volume still shows a correction in place, despite a constructive week on the bullish side.  The SPX looks likely to test the 50-day moving average this week, after putting in a potential rally start on Monday (4/11).

Be on the lookout for an upside follow-through (+1.25% on high trading volume) during the next 4 to 11 trading sessions (4/26 – 5/7).  What you don’t want to see are distribution days, particularly within 3 days of the rally start.  Unfortunately, the SPX rally attempt also had one of those on day 3.

On-balance volume remains in correction territory, but could retest the trendline soon, similar to the other signals.

Weekly price performance of S&P500 sector ETFs

S&P Sector Performance for Week 17 of 2024

Within U.S. equities, all major sectors were green last week.  Technology ($XLK) and Discretionary ($XLY) outperformed the index, thanks to large gains from Alphabet ($GOOGL), Microsoft ($MSFT), and Tesla ($TSLA); more on those results below.  Materials and Healthcare underperformed ($XLB and $XLV, respectively).

Equities were also the best asset class last week, rallying 2.7%. Gold led to the downside, falling 2%.

Weekly price performance by asset class

Asset Class Performance for Week 17 of 2024

COMMENTARY
Despite disappointing economic data, at least for those still clinging to hopes of rate cuts, Magnificent 7 earnings reports stole the show last week.

The first (i.e. “advance”) estimate of Q1 GDP came in well below expectations, showing a slowdown in growth and an increased in inflation (i.e. stagflation environment).  This release showed the large role government spending played in keeping the U.S. economy out of a recession.

PCE for March came in higher than expected as well.  And you know it’s bad (i.e. hawkish) when talking heads switch their focus to justifying why the Federal Reserve doesn’t need to raise rates, rather than the number of cuts this year.

PCE (y/y) Actual Prior Expected
Headline +2.7% +2.5% +2.6%
Core +2.8% +2.8% +2.6%

March Durable Goods orders were higher than expected, but February numbers were revised down, so this release had limited market impact.

On the earnings front, about 1/3 of the S&P500 reported with some interesting surprises along the way.  Tesla ($TSLA) started things off with a miss on both revenue and earnings.  That didn’t stop investors from sending the stock price higher, closing 12% higher the next day.

Alphabet ($GOOGL) beat revenue, crushed earnings estimates, announced a $70 billion stock buyback and it’s first dividend of 0.20/share.  The stock price ended the next session up over 10%.

Microsoft ($MSFT) beat revenue and earnings estimates.  The stock price gapped higher pre-market, but sold off most of Friday’s session, meeting resistance at the 50-day moving average and end the day up less than 2%.

Meta Platforms ($META) beat revenue and earnings estimates, but the stock price was crushed.  Apparently, investors were unhappy with lower revenue forecast and higher capital spending plans.

More earnings this week, as well as jobs data and the latest FOMC rate decision on Wednesday.

Best to Your Week!

P.S. If you find this research helpful, please tell a friend.
If you don’t, tell an enemy.

Sources: Bloomberg, CNBC, Federal Reserve Bank of St. Louis, Hedgeye, Stockcharts.com, U.S. Bureau of Economic Analysis, U.S. Bureau of Labor Statistics

Invest Safely, LLC is an independent investment research and online financial media company.  Use of Invest Safely, LLC and any other products available through invest-safely.com is subject to our Terms of Service and Privacy Policy.
Not a recommendation to buy or sell any security.
Posted in Historical Data, Market Trends | Tagged , , , | Comments Off on Weekend Stock Market Outlook – April 28 2024

Weekend Stock Market Outlook – April 21 2024

Stock Market Outlook entering the Week of April 21st = Downtrend

  • ADX Directional Indicators: Downtrend
  • Price & Volume Signals: Downtrend
  • On Balance Volume Indicator: Downtrend

ANALYSIS
The stock market outlook begins the week in a downtrend, after confirmation during last Monday’s session.

The S&P500 ($SPX) dropped 3% last week, with sellers in control each day.  The index sits ~3% below the 50-day and ~6% above the 200-day moving average.

Technical analysis of daily SPX prices

SPX Price & Volume Chart for the Week of Apr 21 2024

All three technical indicators are in confirmed downtrends.  Price/volume joined the ADX in bearish territory on Monday, after slicing through the 50-day moving average and confirming the downtrend signal.  The price/volume action also pushed OBV into a downtrend.

In total, the SPX gained ~16% (704 points) between the uptrend initiation on November 3 (4358) and the start of the downtrend last Monday (5062).  Now, the outlook is in capital preservation mode until signs of the next rally.  Fortunately, money market funds offer attractive alternatives these days, thanks to higher interest rates.

Weekly price performance by asset class

Asset Class Performance for Week 16 of 2024

Gold was the best asset class for the second week in a row, rising 2%.  Bitcoin led to the downside, although Oil and US Equities weren’t far behind.

Within major equity sectors, Technology ($XLK) was the biggest loser, dropping over 6%, while Utilities ($XLU) gained ~2%.

Weekly price performance of S&P500 sector ETFs

S&P Sector Performance for Week 16 of 2024

COMMENTARY
For the first time since Q3 last year, “buy the dip” gave way to “sell the rip”.  Even “better than expected” Q1 earnings couldn’t stem the tide of selling.  Instead, investors focused on weaker forward guidance, as well as higher-for-longer interest rates and geopolitics.

Last Tuesday, Federal Reserve Chairman Powell spoke at a forum on U.S.-Canada economic relations.  His comments on inflation threw cold water on the rate-cut crowd and sent longer-term interest rates higher:

“The recent data have clearly not given us greater confidence, and instead indicate that it’s likely to take longer than expected to achieve that confidence.”

“We can maintain the current level of restriction for as long as needed.”

Thursday evening, Israel conducted airstrikes against Iranian targets.  The move came as a surprise to many, as most media outlets expected a delayed response due to religious holidays.  Although the events took place outside of market hours, futures spiked; equities down, gold and oil up.  Those knee-jerk reactions were undone by the time the market opened on Friday, but buyers weren’t motivated to put capital at risk in equities over the weekend.

A big week for Q1 earnings, with 4 of the “Magnificent 7” reporting: $MSFT, $GOOG/$GOOGL, $META, $TSLA.  Microsoft, Google, and Meta combine for more than 12% of SPX market cap, so any surprises will have an outsized impact on index performance.

Data-wise, most news outlets will focus on Friday’s release of March PCE, due to its impact on rate cut narratives.  But we’ll also March Durable Goods orders (Wednesday morning) and the first (i.e. “advance”) estimate of Q1 GDP (Thursday morning).

Best to Your Week!

P.S. If you find this research helpful, please tell a friend.
If you don’t, tell an enemy.

Sources: Bloomberg, CNBC, Federal Reserve Bank of St. Louis, Hedgeye, Stockcharts.com, U.S. Bureau of Economic Analysis, U.S. Bureau of Labor Statistics

Invest Safely, LLC is an independent investment research and online financial media company.  Use of Invest Safely, LLC and any other products available through invest-safely.com is subject to our Terms of Service and Privacy Policy.
Not a recommendation to buy or sell any security.
Posted in Historical Data, Market Trends | Tagged , , , | Comments Off on Weekend Stock Market Outlook – April 21 2024

Weekend Stock Market Outlook – April 14 2024

Stock Market Outlook entering the Week of April 14th = Uptrend

  • ADX Directional Indicators: Downtrend
  • Price & Volume Signals: Mixed
  • On Balance Volume Indicator: Mixed

ANALYSIS
The stock market outlook shows an uptrend, but both remaining signals are on the verge of confirming a downtrend so be ready this week.

The S&P500 ($SPX) dropped 1.6% last week, unable to re-establish the trend line and dropping to the 50-day moving average.  The index still sits ~10% above the 200-day moving average.
Technical analysis of daily SPX prices

SPX Price & Volume Chart for the Week of Apr 142024

After a borderline crossover the week prior, the ADX confirmed a downtrend signal last Tuesday.  It’s a similar set-up for On-Balance Volume this week, thanks to a marginal crossover on Friday, so the signal moves to mixed while we look for confirmation early this week.

Institutional selling increased, hitting 8 distribution days within the past 5 weeks, which is above the threshold for a correction.  For now, the price/volume signal shifts to mixed, while we wait to see if the index finds support at the 50-day moving average.

Weekly price performance of S&P500 sector ETFs

S&P Sector Performance for Week 15 of 2024

Every major equity sector in the S&P registered a loss last week.  Relative to the index, Technology ($XLK) outperformed by 1%, while Financials ($XLF) dropped an additional ~2%.

Gold was the best asset class, rising almost 1%, although all 5 underperformed versus the U.S. dollar.  You’d have to dig a bit more into precious metals to find real outperformance (i.e. Palladium, Platinum, Silver).

Weekly price performance by asset class

Asset Class Performance for Week 15 of 2024

COMMENTARY
Stocks have had an incredible run from late October, and the factors in play have changed. Given the recent weakness in equities, it’s a good time to review your holdings and make adjustments (i.e. take profits and redeploy capital).

Inflation continues to be a concern for the Federal Reserve, producers, and consumers.  The March FOMC minutes revealed that the U.S. central bank that wouldn’t commit to rate cuts, out of concern that inflation remains elevated from their targets.  The release of the latest CPI and PPI data validates those worries.

March CPI was higher than expected, with the recent surge in oil and other commodities working its way through supply chains to the consumer.

CPI(y/y) Actual Prior Expected
Headline +3.5% +3.2% +3.4%
Core +3.8% +3.8% +3.7%

On the producer side, Core PPI was the main story.  Even after an upward revision to February data, March came in higher still, and that’s without food and energy costs.

PPI(y/y) Actual Prior Expected
Headline +2.1% +1.6% +2.2%
Core +2.4% +2.1% +2.3%

In response to March inflation readings, the probability of a rate cut moved further into the future.  Last month, the odds of a rate cut in June fell to 50/50, as measured by the CME Group’s 30-Day Fed Fund futures prices.  As of today, probability of a rate cut in June is less than 30%, and July is 50/50.

Earnings season kicked off last week with big banks (JPMorgan Chase, CitiGroup, and Wells Fargo) beating expectations.  This week the announcements really get going:

https://platform.twitter.com/widgets.js

Best to Your Week!

P.S. If you find this research helpful, please tell a friend.
If you don’t, tell an enemy.

Sources: Bloomberg, CNBC, Federal Reserve Bank of St. Louis, Hedgeye, Stockcharts.com, U.S. Bureau of Economic Analysis, U.S. Bureau of Labor Statistics

Invest Safely, LLC is an independent investment research and online financial media company.  Use of Invest Safely, LLC and any other products available through invest-safely.com is subject to our Terms of Service and Privacy Policy.
Not a recommendation to buy or sell any security.
Posted in Historical Data, Market Trends | Tagged , , , | Comments Off on Weekend Stock Market Outlook – April 14 2024