Stock Market Outlook entering the Week of November 10th = Uptrend
- ADX Directional Indicators: Uptrend
- On Balance Volume Indicator: Uptrend
- Institutional Activity (Price & Volume): Uptrend
ANALYSIS
The stock market outlook remains in an uptrend, after a bullish response to U.S. election results and another rate cut by the FOMC.
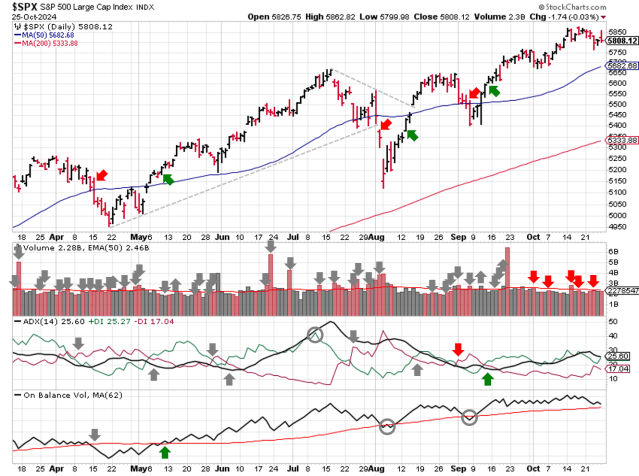
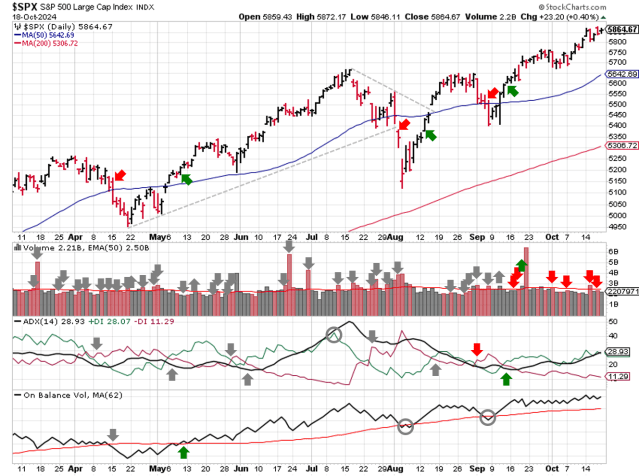
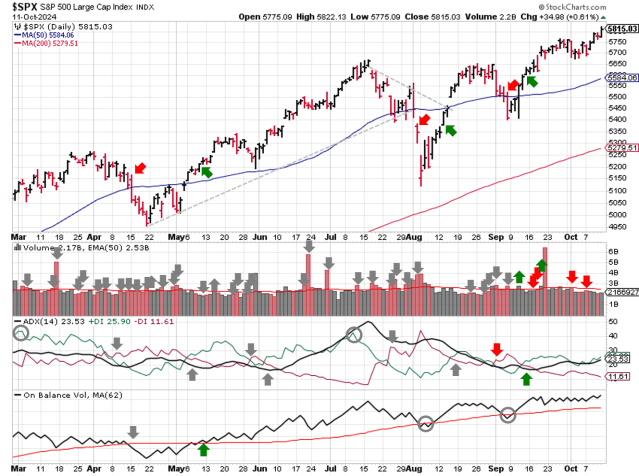
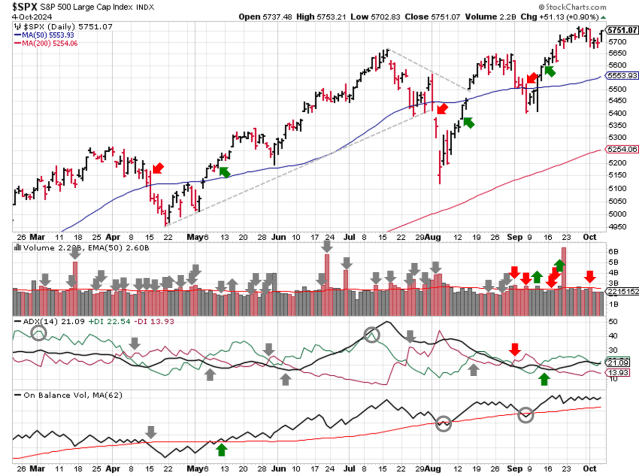
The S&P500 ( $SPX ) rallied 4.7%. The index sits ~5% above the 50-day moving average and ~11% above the 200-day moving average.

SPX Price & Volume Chart for Nov 10 2024
All three signals are back to an uptrend. The ADX ( Average Directional Index ) and Institutional Activity rejoined OBV ( On-Balance Volume ) in bullish territory.

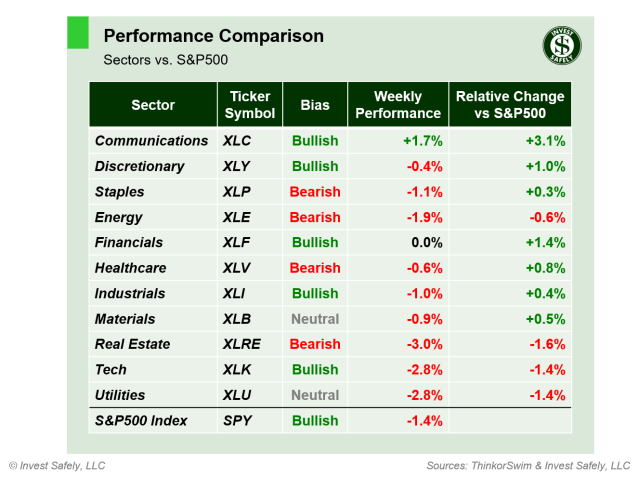
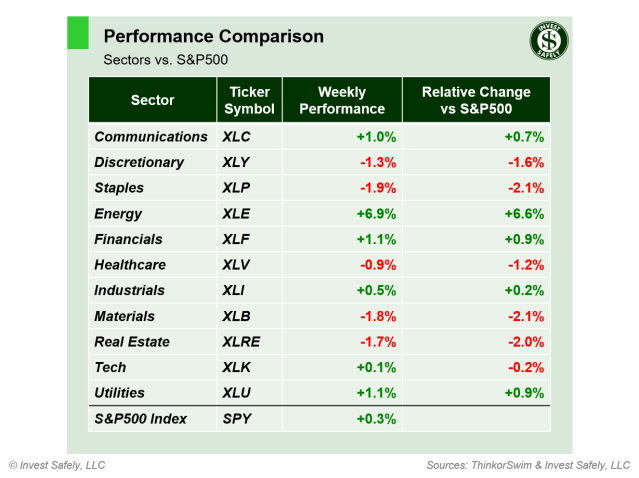
S&P Sector Performance for Week 45 of 2024
Utilities ( $XLU ) shifted back to bullish from neutral and Real Estate ($XLRE ) switched from bearish to neutral. The energy sector ( $XLE ) was the biggest mover, jumping from bearish to bullish bias with a 6.5% gain. Industrials ( $XLI ) also outperformed with a gain of 6%. The worst sector was Consumer Staples ( $XLP ) with a gain of less than 1%.
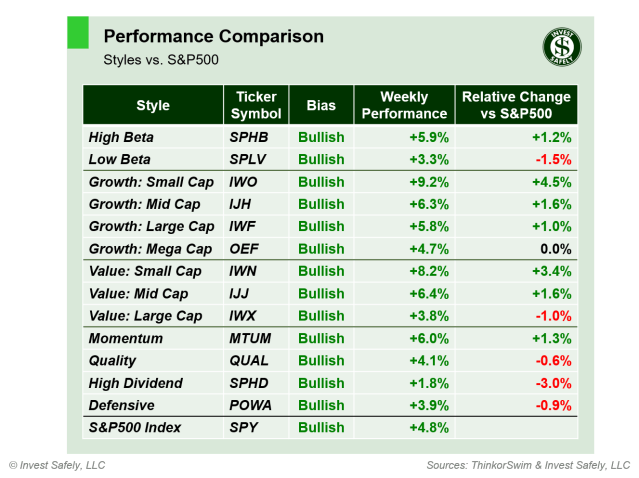
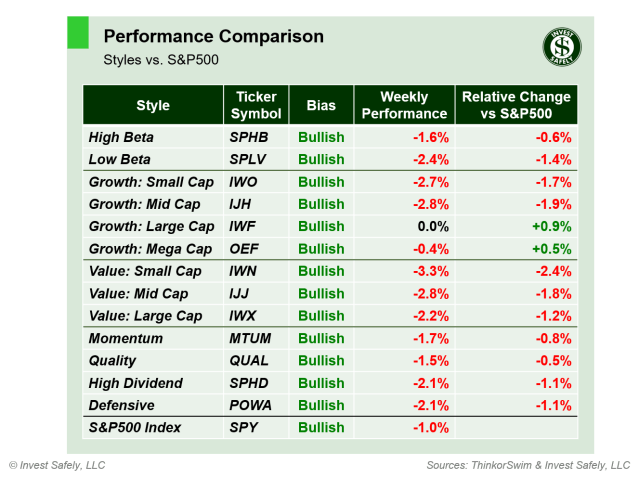
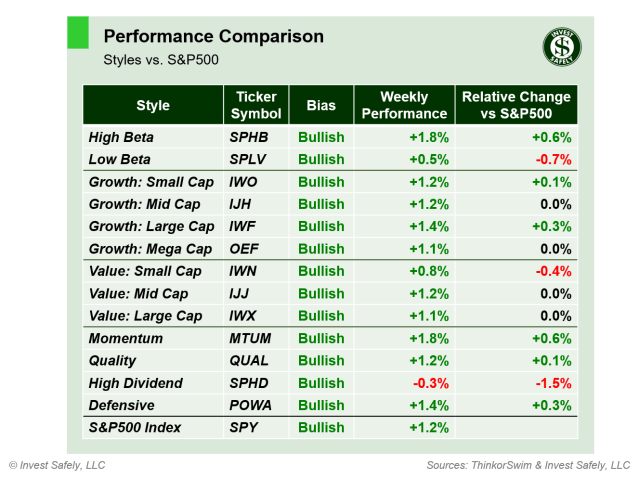
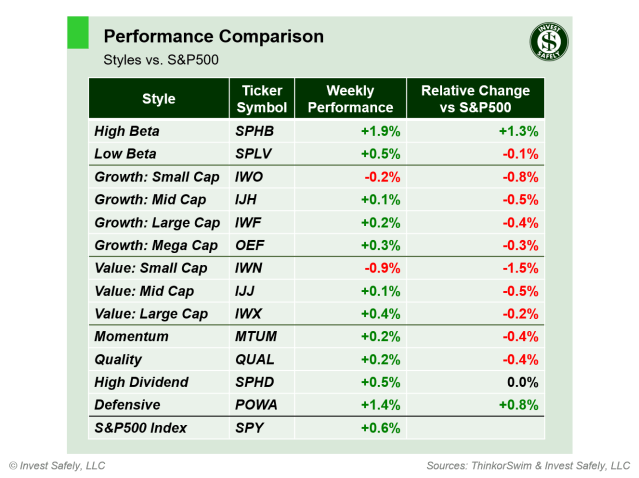
Sector Style Performance for Week 45 of 2024
Low Beta, Small Cap Value, Quality and High Dividend sector styles moved back to a bullish bias last week. Small Cap Growth ( $IWO ) led the way higher (same as the week prior), while High Dividend ( $SPHD ) underperformed the general index by 3%.

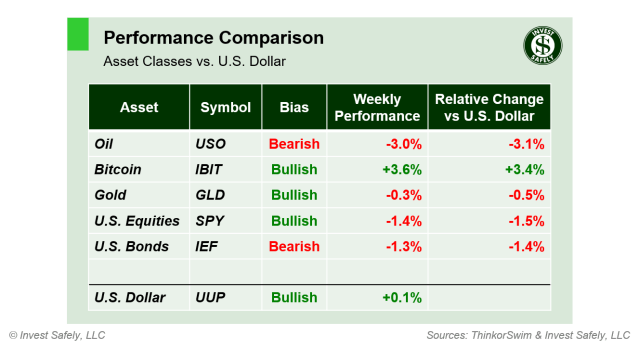
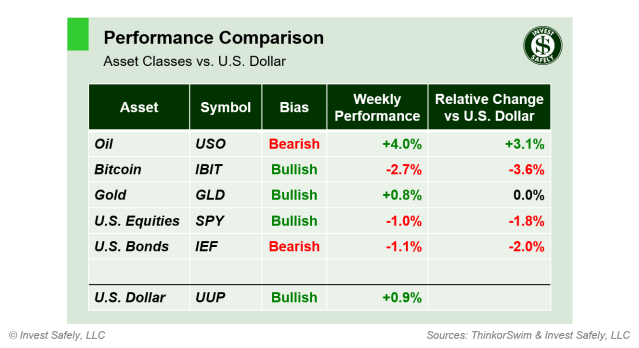
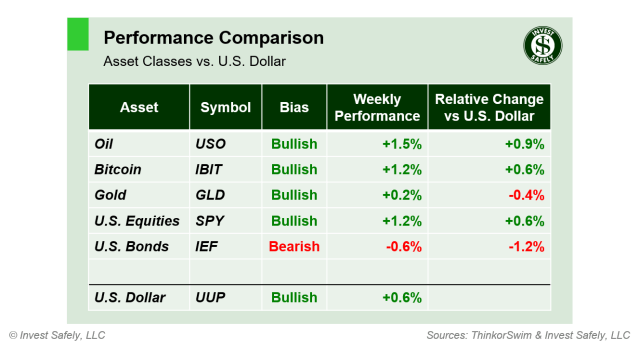
Asset Class Performance for Week 45 2024
Bitcoin ( $IBIT ) was the best asset class, rallying another 11%, while gold ( $GLD ) fell nearly 2%. Oil ( $USO ) shifted from bearish to neutral bias as well.
COMMENTARY
Election-related volatility stole the show last week, with most risk assets responding with strong upside moves to expected policy shifts. That said, most asset classes, equity sectors, and investing styles are now overbought.
In other macro news, Services PMI was expansionary and higher than expected, hitting levels last seen in 2022. Adding more juice to the economy, the FOMC cut rates another 25 bps, citing strong economic data and tame inflation levels. However, they still feel their policy is restrictive, and plan to continue the current rate cutting cycle, albeit at a “slower” pace.
Behind the scenes, the Federal Reserves balance sheet run-off (i.e. QT) continues, with assets down to roughly the April 2020 level, or the balance after the first wave of Covid-19 quantitative easing. There are some rumblings about financial sector liquidity, because the reverse repo facility is below $200b for the first time since 2021.
During the coming week, we’ll get another set of inflation data (October CPI/PPI), along with more earnings reports.
Best to Your Week!
P.S. If you find this research helpful, please tell a friend.
If you don’t, tell an enemy.