Stock Market Outlook entering the Week of December 22nd= Uptrend
- ADX Directional Indicators: Downtrend
- Institutional Activity (Price & Volume): Mixed
- On Balance Volume Indicator: Uptrend
ANALYSIS
The stock market outlook remains in an uptrend, despite the lump of coal delivered by equities last week.
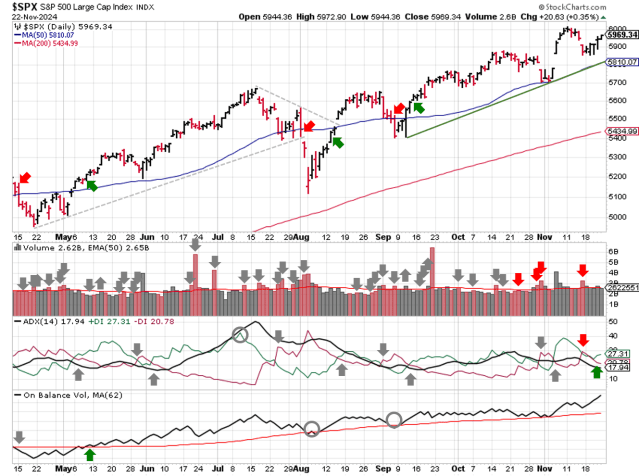
When all was said and done, the S&P500 ( $SPX ) lost 2%. The index is basically resting on the 50-day moving average and ~7% above the 200-day moving average, thanks to a boost from Friday’s massive options expiration.

SPX Price & Volume Chart for Dec 22 2024
The ADX ( Average Directional Index ), Institutional Activity and OBV ( On-Balance Volume ) aren’t providing a clear signal yet, so the overall outlook remains unchanged.
Short-term (ADX) is bearish, responding to the lower lows and lower high. Mid-term (Institutional Activity) is mixed, with the index trading down to the 50-day moving average, but only a small number of distribution days. Long-term (On Balance Volume) is still bullish, though does show the impact of selling pressure since the start of the month.

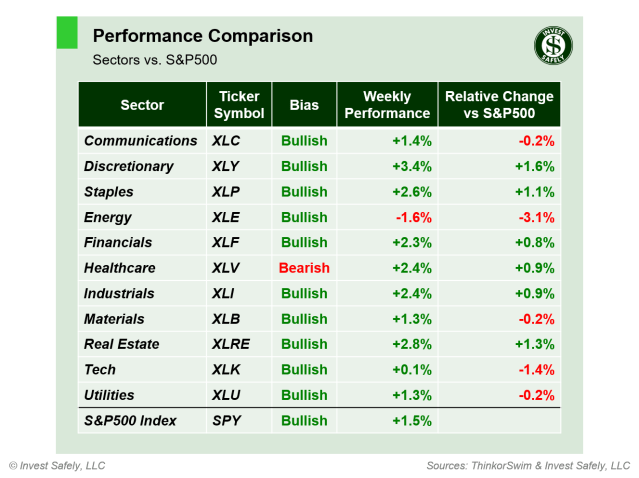
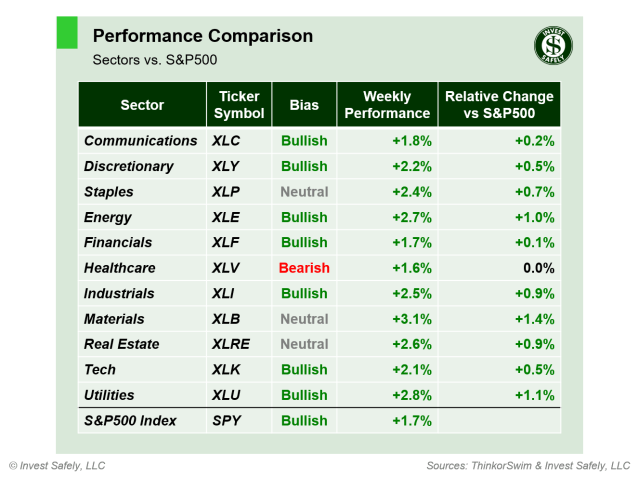
S&P Sector Performance for Week 51 of 2024
While the index itself lost 2%, the SPY’s dividend payment eased the sting of last week’s loss a bit. That said, a rough week across the sectors; all of them ended in the red.
The least “bad” was Technology ( $XLK ), which lost 1.3%. Energy ( $XLE ) led to the downside, dropping almost 6% and doubling its losses over the past 4 weeks.
Bullish trends remain for the sectors containing Mag 7 companies. Consumer Staples ( $XLP ) and Industrials ( $XLI ) dropped into bearish trends (i.e. downside risk higher probability then upside potential), and Financials ( $XLY ) fell to neutral.

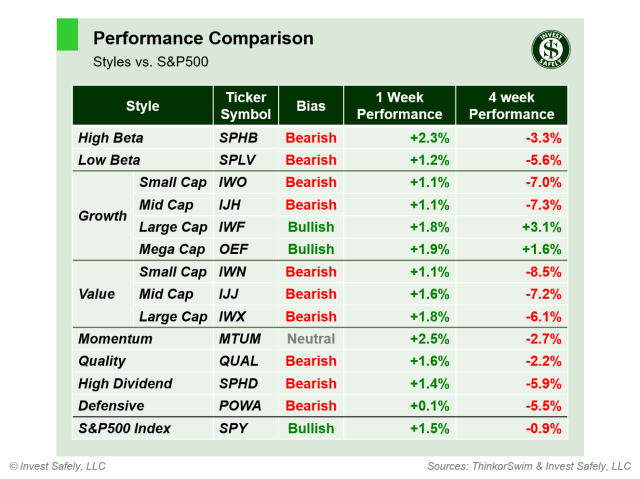
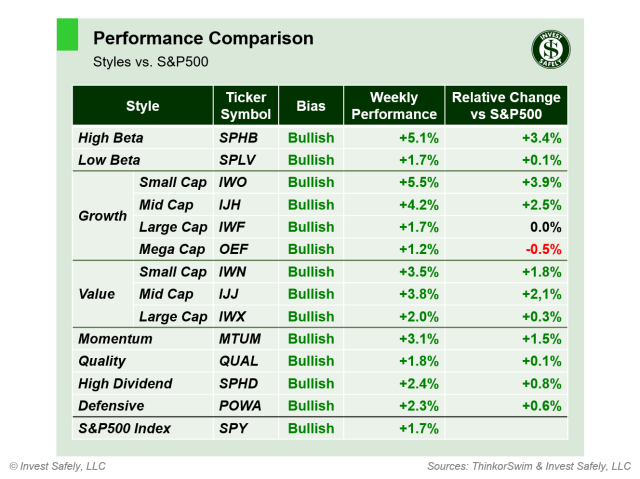
Sector Style Performance for Week 51 of 2024
Much like the equity sectors, equity styles also had a rough week, showing limited strength outside Mag 7 related categories. Large Cap Growth ( $IWF ) was the best performing sector style again, but this week only managed to limit the losses. Small Cap Value ( $IWN ) fell almost 6%, one week removed from moving to bearish trend.
Other styles moving to bearish trends this week: High Beta, Small Cap Cap and Mid-Cap Growth, Small, Mid, and Large Cap Value, Momentum, Quality and Defensive.

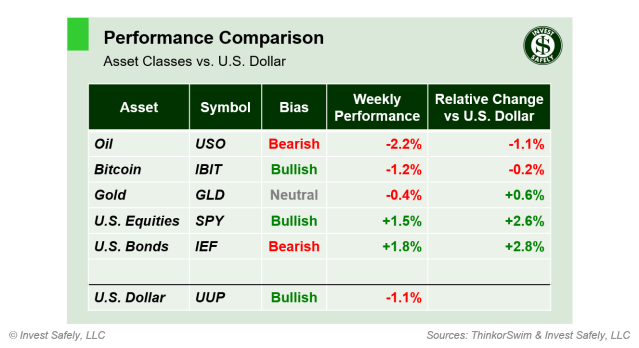
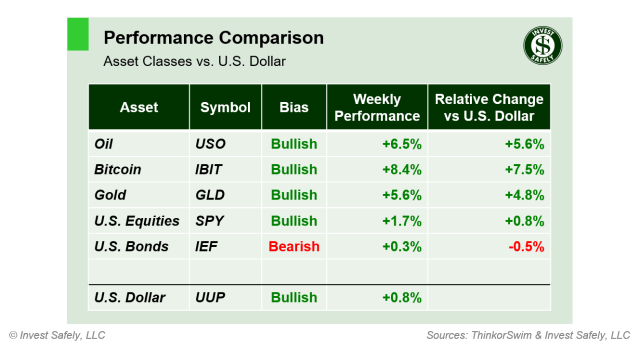
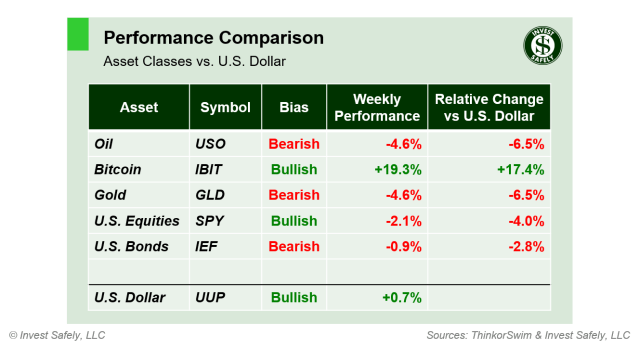
Asset Class Performance for Week 51 2024
Diversification wasn’t going to help your money last week. All asset classes felt the pain. The U.S. dollar led to the upside, which does tend to hurt dollar-denominated asset prices (and other currencies). Gold was the best performer, although it’s still in a bearish trend. Bitcoin led to the downside, but remained in a bullish trend. Oil ( $USO ) dropped back to neutral trend again last week.
COMMENTARY
Volatility returned last week, in a big way, sparked by the markets response to the FOMC meeting.
The FOMC cut the overnight interest rate another 0.25%, which wasn’t a surprise. Perhaps more impactful was their increase in inflation expectations for next year, sparking fears of a pause in rate cuts and renewing a focus on the un-inversion of the yield curve (i.e. rising interest rates) over the past quarter.
Equities headed south almost immediately after the press release, and the selling accelerated into the close of the session. Friday’s options expiration reversed some of the damage, and indexes held up fairly well thanks to some of the Mag 7 companies and their latest dividend.
Q3 GDP was revised slightly higher, for a final reading of 3.1%. If you dig a bit into the y/y data, you’ll see that real GDP declined versus 2023 Q3. As for the Fed’s preferred inflation metric (PCE), the Headline figure for November came in slightly higher, while core remained unchanged at 2.8%.
| PCE (y/y) |
Actual |
Prior
|
Expected |
| Headline |
+2.4% |
+2.3% |
+2.5% |
| Core |
+2.8% |
+2.8% |
+2.9% |
“What to do now” is a question on many minds, with regard to adjusting portfolios and reallocating capital. It’s not the time to liquidate everything; market participants will need time to respond and adjust their asset allocations without moving the markets too much.
Speaking of changes, big moves by institutions are unlikely until January, thanks to lower trading volumes over the holiday season. There are only 5.5 trading sessions left this year, close early on Tuesday and remain closed until Thursday. Intraday trading volumes are likely lower than average as well.
Even if your tea leave reading is on hold, the recent market moves do highlight the importance of signal based rules, pre-set targets, etc.: If this, then that.
If a ticker trips a condition and generates a signal in your process, you execute. Then, while you’re waiting for the next signal, you evaluate the prior trade. Did the process work as intended? If not, make improvements. With the end of the year just around the corner, now is a great time to review your 2024 performance and adjust for 2025.
Best to Your Week, Happy Holidays and a Very Merry Christmas!
P.S. If you find this research helpful, please tell a friend.
If you don’t, tell an enemy.
Sources: Bloomberg, CNBC, Federal Reserve Bank of St. Louis, Hedgeye, Stockcharts.com, TradingEconomics.com, U.S. Bureau of Economic Analysis, U.S. Bureau of Labor Statistics
Invest Safely, LLC is an independent investment research and online financial media company. Use of Invest Safely, LLC and any other products available through invest-safely.com is subject to our Terms of Service and Privacy Policy.
Not a recommendation to buy or sell any security.