
Stock Market Outlook: April 12th = Downtrend
The stock market outlook continues with a downtrend until a second indicator confirms the new rally.
Bitcoin, Technology and Momentum plays led assets higher, while Oil, Energy, and High Dividends underperformed. Markets welcomed cease-fire headlines and volatility retreated across the board, while investors await the start of earnings season this week.
TREND ANALYSIS
The S&P500 ( $SPX ) rose 3.6% last week, rallying further from September lows and reclaiming widely followed moving averages. The index is now:
- ~1% above the 50-day moving average
- ~2% above the 200-day moving average
Institutional activity shows firms buying the dip last week from deeply oversold levels. Now we’re waiting on another indicator to confirm the bullish move.
- Average Directional Index: Bearish
- Trend strength has leveled off, and the directional indicators are nearing a cross-over.
- Institutional Activity: Bullish
- Follow-through on Day 6 (Wednesday) confirmed a new rally; trading volume was just okay though.
- Price also reclaimed the 50-day moving average
- On-Balance Volume: Bearish
- Rebounding to the long-term average
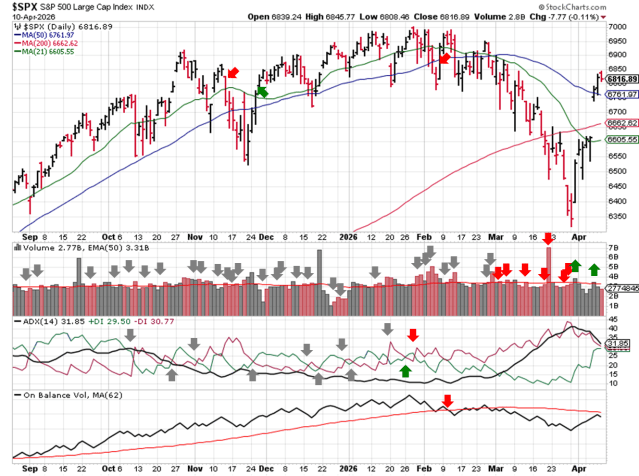
SPX Price & Volume Chart – 2026-04-12
PERFORMANCE HIGHLIGHTS & COMPARISONS
Asset Classes
Bitcoin ( $IBIT ) led assets higher last week, reflecting a risk-on mood after the cease-fire announcement. No surprise that Oil ( $USO ) lagged. All equities ( $SPY, $VEA, $EEM ) regained bullish bias, along with U.S. Bonds ( $IEF ). EM bonds and the dollar flipped to neutral.
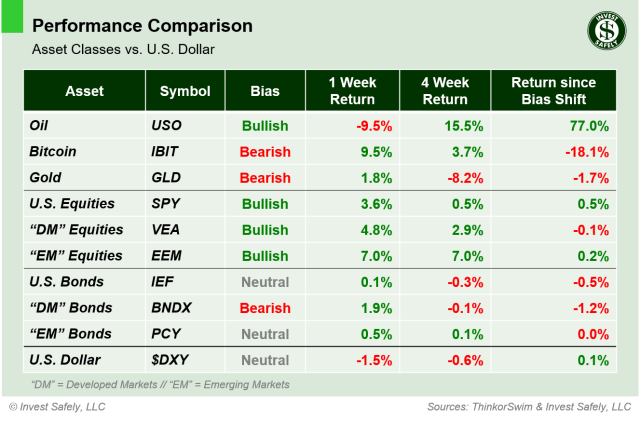
Asset Class Performance – 2026-04-12
S&P500 Sectors
Technology ( $XLK ) outperformed and Energy ( $XLE ) gave back more of its recent gains. Industrials, Materials, Real Estate, and Technology ( $XLI, $XLB, $XLRE, $XLK ) reclaimed bullish bias.
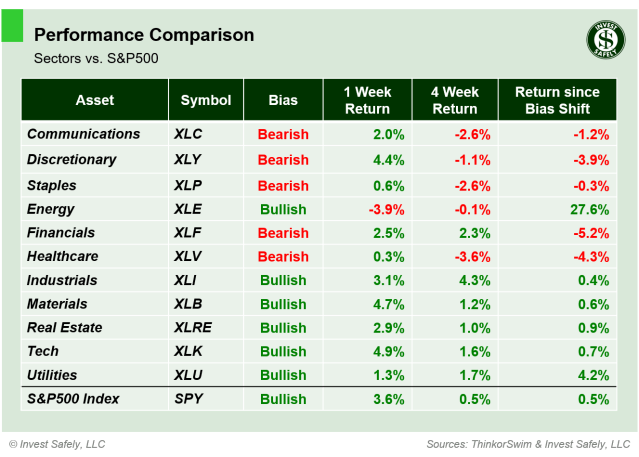
S&P Sector Performance – 2026-04-12
S&P500 Investing Styles
Momentum ( $MTUM ) more than doubled its gain from last week to lead styles higher. High Dividend ( $SPHD ) was the worst performer and came in flat. Several styles ( $SPHB, $IJH, $OEF, $IWN, $IJJ, $IWX, $MTUM ) improved to bullish. Small Cap Growth and came up to neutral ( $IWO, $QUAL ).
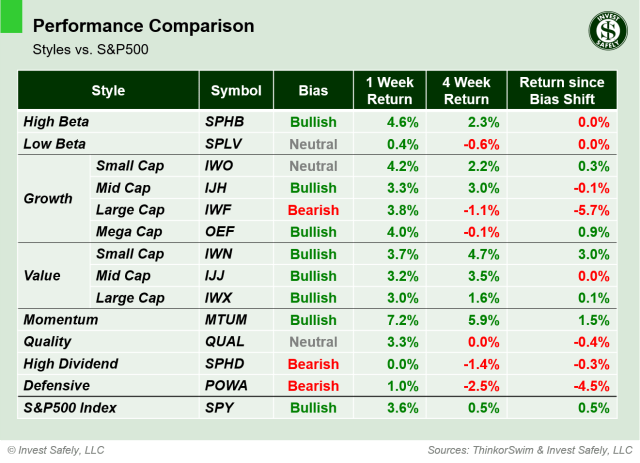
Sector Style Performance – 2026-04-12
COMMENTARY
Markets
Now that volatility retreated a bit and price reclaimed key levels, it’s a good time to assess the wreckage. For example, sectors that held up well during the recent correction ( e.g. Utilities ) are places to investigate further, while those that didn’t see any inflows ( e.g. Healthcare ) are lower probability.
The areas that performed well last week ( i.e. bounced off the lows ) are also overbought, so best to wait for the first retrace/retest of key levels before deploying more capital. A pause will sort out which moves were just short-covering, and which are actual accumulation.
Macroeconomic Data & Policy
Durable goods declined 1.4% month over month, and February data was revised lower as well. It was the third straight decline.
The final Q4 GDP figure came in at +0.5%, down from +0.7% in the second estimate, and well below the initial +1.4% level. So the economy slowed in the 4th quarter, from a rate of change perspective ( i.e. year over year ).
February PCE showed relatively tame inflation, with “Headline” data flat at +2.8% y/y, and “Core” data easing to +3% y/y. On the other hand, March CPI showed “Headline” inflation increasing to +3.3% y/y, and “Core” trending higher to +2.6% y/y.
The FOMC meeting minutes revealed officials still expect to cut interest rates this year, but are open to rate hikes if inflation remains elevated. They also raised their yearly inflation forecast to +2.7%.
April’s preliminary University of Michigan’s Consumer Sentiment Index dropped to record low. Surveys cited consumer concerns relating to higher prices, higher inflation expectations, and economic fallout from global conflict.
Geopolitics
The U.S. and Iran reached a temporary ceasefire last week, which was the catalyst for equities to rally. Although drone and missile strikes continued throughout the region, both sides claimed “victory” while using back-channels to set-up negotiations. As of this post, it appears the weekend negotiations didn’t result in any further progress.
EYES ON THE HORIZON
Not a lot of macro data catalysts on the schedule, but that shouldn’t be a problem. Earnings season kicks off next week with bog banks, and there’s sure to be daily geopolitical developments.
- Monday: —
- Tuesday: March PPI
- Wednesday: —
- Thursday: —
- Friday: —
Best to Your Week!


