
Stock Market Outlook: March 29th = Downtrend
The stock market outlook continues in a downtrend, though there are pockets of oversold conditions despite the elevated volatility.
Oil and Energy continue to outperform, and were joined by small cap value this week. Bitcoin, Communications, and Large Cap Growth underperformed. Mixed survey data and a downbeat consumer didn’t do anything to combat uncertainty caused by the conflict in West Asia.
TREND ANALYSIS
The S&P500 ( $SPX ) dropped 2.1% last week, falling further below key moving averages. Th index is now:
- ~7% below the 50-day moving average
- ~4% below the 200-day moving average
All 3 technical indicators remain bearish and have shown no signs of changing sides yet:
- Average Directional Index: Bearish
- A strong bearish trend is underway
- Institutional Activity: Bearish
- Price continues to drop below key moving averages on elevated volume
- On-Balance Volume: Bearish
- Remains below the long-term average
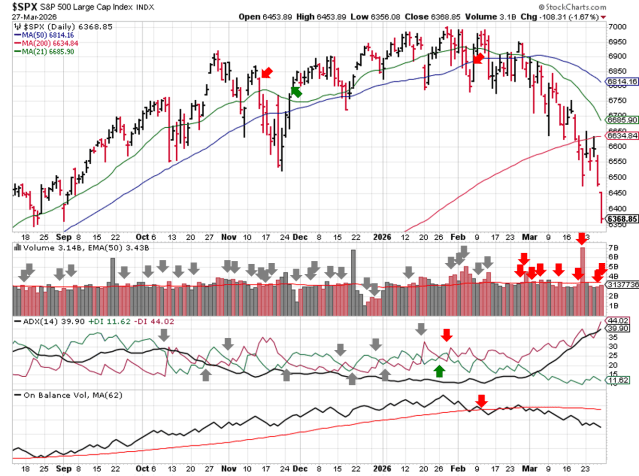
SPX Price & Volume Chart – 2026-03-29
PERFORMANCE HIGHLIGHTS & COMPARISONS
Asset Classes
Oil ( $USO ) continued its recent win streak in weekly performance, while Bitcoin lost the most ground. Only Oil and the U.S. dollar are bullish.
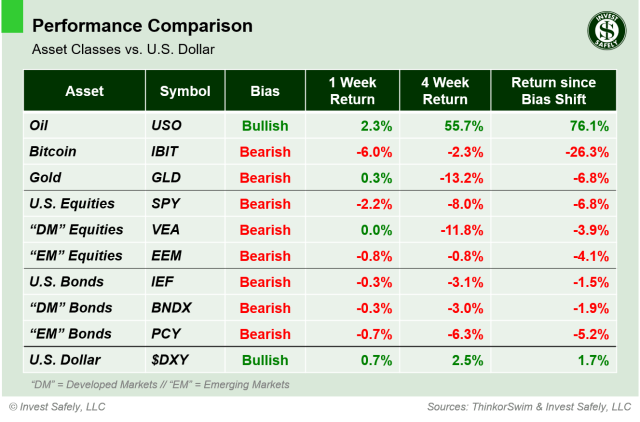
Asset Class Performance – 2026-03-29
S&P500 Sectors
Thanks to the strength in Oil, Energy ( $XLE ) continues to resist the selloff, gaining over 5% last week despite the general market dropped more than 2%. Communications was the worst sector ( $XLC ), thanks in large part to declines by Alphabet and Meta ( $GOOGL & $META ). Utilities ( $XLU ) managed to regain bullish bias.
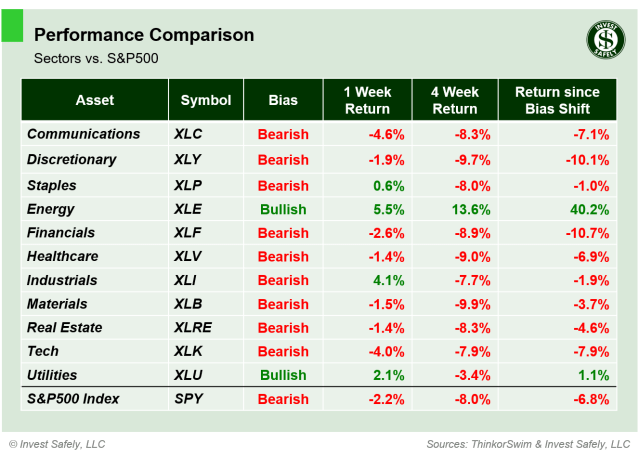
S&P Sector Performance – 2026-03-29
S&P500 Investing Styles
Small Cap and Mid Cap Value overperformed and Large Cap Growth underperformed. All sector styles are bearish.
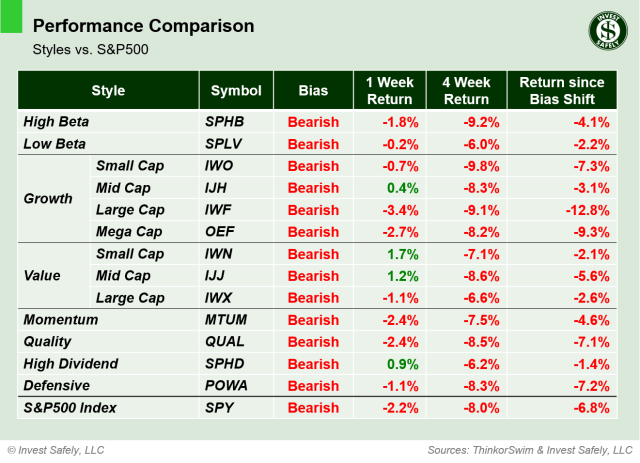
Sector Style Performance – 2026-03-29
COMMENTARY
Markets
The Volatility Index ( $VIX ) is back on the rise and looks destined to close above 30. Bond volatility ( $MOVE ), remains above 110. Both continue to signal markets under stress. While many areas in the equities and bonds are oversold verses most traditional technical indicators, markets also tend to crash from oversold levels when volatility is elevated like it is right now.
No need to try and pick a bottom. Adding to positions when they’re below the 200 day moving average is usually a good bet for long-term investors, but the inflationary shock from oil prices has yet to be absorbed. Wait for prices to re-establish themselves in bullish bias, or at least get back above key moving averages. The focus on sectors, styles, and industry groups that are showing the most strength.
Macroeconomic Data & Policy
Manufacturing PMI climbed to 52.4 in March 2026, up substantially from last year. Other the flip side, Services PMI fell to 51.1, down significantly from last year. Since services has become a larger percentage of the overall economy, this divergence does not bode well for economic growth.
Consumer Sentiment fell year over year, for all age groups and political affiliations. Households with middle and higher incomes, as well as those with significant investments, experienced the steepest drops in confidence.
Geopolitics
Shipping disruptions continue in the Strait of Hormuz, which directly impacts the price of oil and indirectly impacts the price of almost everything else, from diesel fuel and shipping costs, to synthetic fibers for clothing, to detergents and fertilizers…let along plastic.
President Trump postponed further U.S. attacks on Iranian energy grids to provide a window for “negotiations”, but its not clear who is negotiating with whom at this point. In the meantime, strikes and counterstrikes continue across the region.
EYES ON THE HORIZON
Next week the markets are closed for Good Friday, though NFP data will still be released. We’ll get several updates on employment, as well we a speech from Fed Chair Powell and the latest ISM Manufacturing survey data.
- Monday: Powell Speech
- Tuesday: JOLTS
- Wednesday: ADP non-farm payrolls, Retail Sales, ISM Manufacturing
- Thursday: —
- Friday: Markets Closed, Non-Farm Payrolls
Best to Your Week!


