
Stock Market Outlook: March 22nd = Downtrend
The stock market outlook continues in a downtrend and price fell below long-term technical indicators.
Oil and Energy outperformed again, while Gold, Utilities, and Low Volatility underperformed. The FOMC held rates steady, while investors were busy repricing risk across asset classes.
TREND ANALYSIS
The S&P500 ( $SPX ) dropped 1.9% last week, slicing through the 200-day moving average. Price is now:
- ~5% below the 50-day moving average
- ~2% below the 200-day moving average
All 3 technical indicators remain bearish and have shown no signs of changing sides yet:
- Average Directional Index: Bearish
- A strong bearish trend is underway
- Institutional Activity: Bearish
- Price fell below the 200-day moving average on elevated volume
- On-Balance Volume: Bearish
- Remains below the long-term average
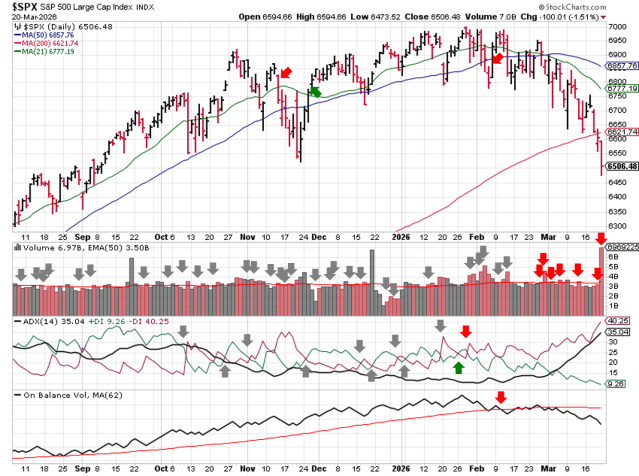
SPX Price & Volume Chart – 2026-03-22
PERFORMANCE HIGHLIGHTS & COMPARISONS
Asset Classes
Oil ( $USO ) was the only asset to register a gain, while Gold ( $GLD ) led to the downside again after dropping 10%! Gold, along with U.S. Bonds ( $IEF ), dropped to Bearish bias as well.
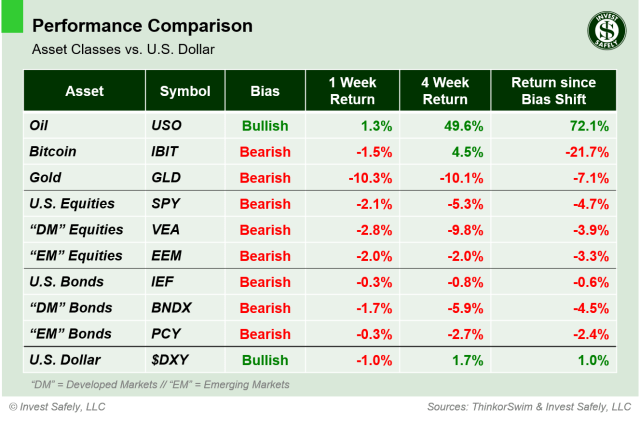
Asset Class Performance – 2026-03-22
S&P500 Sectors
Energy ( $XLE ) continues to resist the selloff, and Financials managed to finish in the green. Utilities ( $XLU ) bore the brunt of the selling last week, though Industrials ( $XLI ) and Staples weren’t far behind. Consumer Staples and Real Estate ( $XLP, $XLRE ) dropped to bearish bias; Utilities fell to neutral.
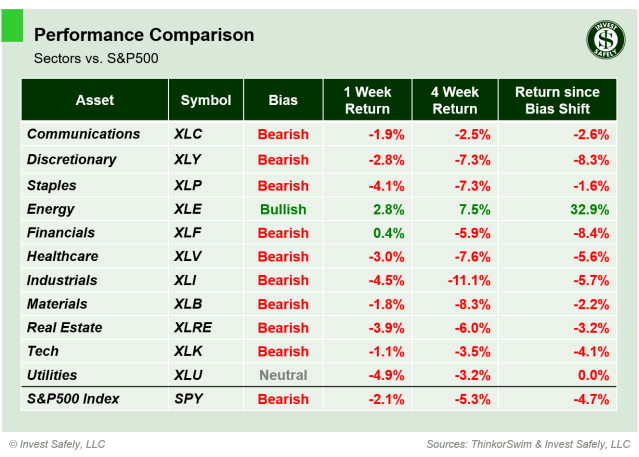
S&P Sector Performance – 2026-03-22
S&P500 Investing Styles
In a strange twist, High Beta ( $SPHB ) outperformed and Low Beta ( $SPLV ) underperformed during last weeks selling! Low Beta also dropped to bearish bias, putting the entire style space into risk-off.
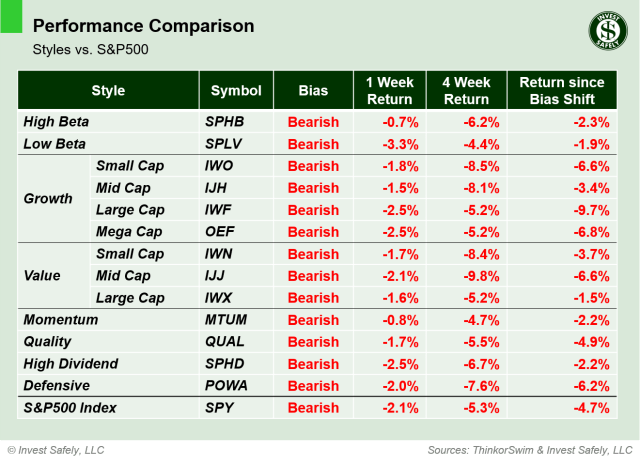
Sector Style Performance – 2026-03-22
COMMENTARY
Markets
Oil and the US dollar are the only assets in bullish trends. Equities remain risk off, despite being deeply oversold per most technical analysis techniques. Even traditional safety plays, like Low Volatility and Utilities, have led to the downside during the past two weeks. The sectors to watch from last week, Consumer Staples and Real Estate ( $XLP, $XLRE ), did indeed test their bias turning points. Both failed. Just another reminder that when an asset class sells off, there are few, if any, places to hide.
The Volatility Index ( $VIX ) was flat on the weekly basis, but it’s uptrend remains intact. Bond volatility ( $MOVE ), or more accurately Treasury Yield Volatility, was and is the real story, as it continues the recent breakout. The index jumped 28% on Friday to a reading of 108, in response to large moves in Treasury yields.
Why is the change in Treasury yields the real story? Because fixed income is the second largest market in the world behind currencies, and U.S. treasuries drive that market. Sudden changes in treasury yields cause nearly every financial asset to be repriced, force portfolio managers to rebalance risk, and ultimately shift capital flows.
Case in point: Gold. The ultimate safe haven asset dropped 10% last week and is now bearish bias, which seems counterintuitive. Why? When financial markets start to go sideways, traders sell what they can to cover what they must. Gold had been winning bigly, especially if you were using leverage as many institutions do. With the U.S. Dollar and Treasury’s sharply higher, investors are forced to sell winning positions offset losing positions in other areas in order to rebalance, de-risk, or meet margin calls. To a lesser extent, this behavior also explains some of the move in recent winning sectors like Materials and Industrials,
Macroeconomic Data & Policy
Headline PPI was flat year over year year at +3.4%. Core PPI rose 20 bps +3.9% y/y. Combined with CPI and PCE, the FOMC chose to leave rates unchanged. And it’s no longer clear when we’ll see the next rate cut. The spike in treasury yields actually caused probability markets to start pricing in rate hikes!
Geopolitics
Even for the best traders and investors are having a tough time in today’s headline/event market. Financial markets hate uncertainty, and uncertainty is the only thing that certain at the moment. Our collective struggle is one of the side-effects from a “flood the zone” communication strategy:
“Flood the zone” is a political / media strategy designed to overwhelm, disorient, and distract by releasing large volume and/or rapid succession of news, accusations, or information.
When the strategy is applied to military actions involving a linchpin of the global energy market ( Oil and the Strait of Hormuz ), an element of uncertainty is injected into every supply chain on the planet. Rising uncertainty equals rising risk, which you’re seeing reflected in prices and interest rates real-time.
EYES ON THE HORIZON
The good news is that on the other side of the current turmoil are new opportunities. The time will come to redeploy capital into assets, sectors, and styles with new bullish trends.
Next week is a lighter data release schedule, with data from two surveys incoming: Flash PMI and Michigan Consumer Sentiment. Flash PMI compiles responses from purchasing managers on business conditions like employment, production, orders, pricing, deliveries, inventories, etc.
- Monday: —
- Tuesday: Flash PMI
- Wednesday: —
- Thursday: —
- Friday: Michigan Consumer Sentiment
Best to Your Week!


