
Stock Market Outlook: March 15th = Downtrend
The stock market outlook enters week 6 of the current downtrend, as volatility continues to rise.
Oil, Energy and Momentum outperformed; Gold, Consumer Discretionary, Materials, and High Dividends underperformed. Inflation data was mixed ahead of this week’s FOMC decision.
TREND ANALYSIS
The S&P500 ( $SPX ) dropped 1.6% last week:
- ~3.5% below the 50-day moving average
- ~0.5% above the 200-day moving average
All 3 technical indicators remain bearish and highlight weakness in the index:
- Average Directional Index: Bearish
- The base ADX number is on the rise, signaling a strengthening trend
- Institutional Activity: Bearish
- Price fell further below the 50-day moving average
- On-Balance Volume: Bearish
- Remains below the long-term average
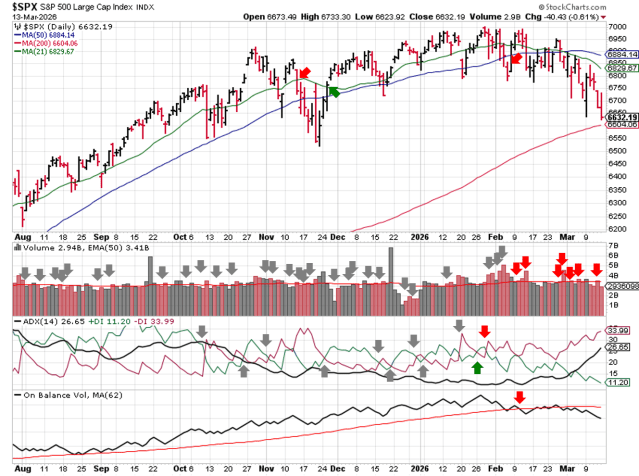
SPX Price & Volume Chart – 2026-03-15
PERFORMANCE HIGHLIGHTS & COMPARISONS
Asset Classes
Oil ( $USO ) led assets higher again last week, gaining another 10%; that’s +52% in the past 4 weeks, and +70% since the bias shifted. Gold ( $GLD ) led to the downside. Development Market Equities ( $VEA ) fell to Bearish bias.
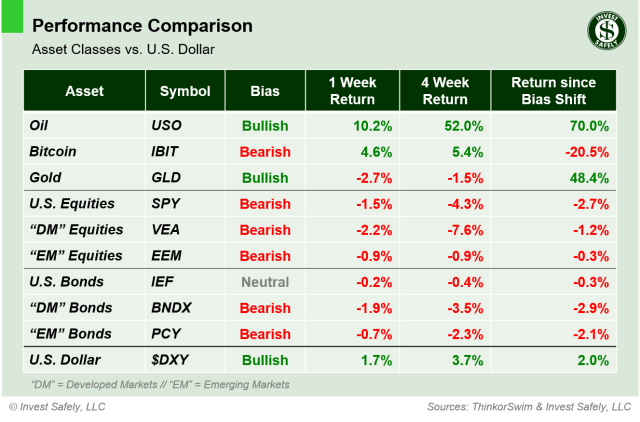
Asset Class Performance – 2026-03-15
S&P500 Sectors
Energy ( $XLE ) was the best sector; Consumer Discretionary and Materials ( $XLY, $XLB ) were the worst. Communications, Industrials, and Materials ( $XLC, $XLI, $XLB ) moved to bearish bias.
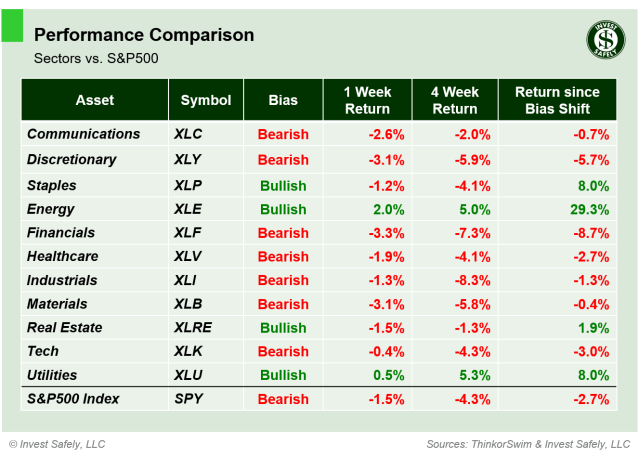
S&P Sector Performance – 2026-03-15
S&P500 Investing Styles
Momentum ( $MTUM ) squeezed out the sole gain in investing styles. High Dividend and Defensives ( $SPHD, $POWA ) were bottom of the barrel. There were no bias changes last week.
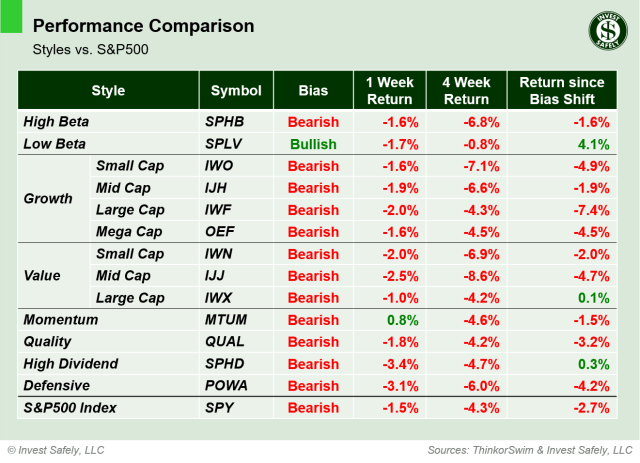
Sector Style Performance – 2026-03-15
COMMENTARY
Markets
Investors continue to pile into the U.S. Dollar ( $DXY ), pushing the reserve currency up almost 2% last week and creating more headwinds for and assets that aren’t oil. Bitcoin ( $IBIT ) consolidated near 65,000, but didn’t benefit from the “flight to safety” trade.
Treasury yields rallied off of lows last week, sending rates higher and bond funds lower. Apparently, investors are concerned that energy prices will remain higher for longer, which will keep inflation higher for longer. This week’s FOMC meeting will be interesting.
Equities had another rough week. Recent sector strongholds have sold off over the past two weeks. Industrials and Materials are now bearish bias. Consumer Staples and Real Estate ( $XLP, $XLRE ) look set to test their turning points shortly.
The Volatility Index ( $VIX ) ended the week at 27; down from the open at 35 ( ! ), but still in Hedgeye’s “chop-bucket” ( elevated uncertainty ) and continuing to trend higher. Bond volatility ( $MOVE ) broke out last week too, getting into it’s version of the “chop-bucket” between 80 and 100.
Until volatility retreats, caution and patience is warranted.
Macroeconomic Data & Policy
Inflation data was mixed. The Consumer Price Index ( CPI ) showed slowing inflation year over year; Headline CPI fell 40 basis points to 2.4% and Core dropped 60 basis points to 2.5%. The Personal Consumption Expenditures ( PCE ) index showed rising prices; Headline PCE climbed 40 basis points to 2.8%, and Core rose 50 basis points to 3.1%.
The revised 2025 Q4 GDP figures showed a growth rate of 0.7%, cutting the first estimate in half and coming in well below the 1.9% increased seen in Q4 2024. A decline in government spending had the biggest impact ( government shutdown ).
Job Openings and Labor Turnover Survey ( JOLTS ) rebounded from December’s 5-year low, but are still lower on a year over year basis.
Geopolitics
The Strait of Hormuz closure, bombing of Kharg Island, and U.S. Treasury waver for Russian oil dominated headlines and generated a lot of volatility in the fossil-fuel energy space.
EYES ON THE HORIZON
This week, the FOMC announces their latest decision on interest rates, and we get a Producer Price Index ( PPI ) update and the latest housing data. Don’t overlook options expiration at the end of the week.
- Monday: —
- Tuesday: Pending Home Sales
- Wednesday: PPI & FOMC Rate decision
- Thursday: New Home Sales
- Friday: Weekly, Monthly, and Quarterly Options Expiration
Best to Your Week!


