
Stock Market Outlook: March 1st =Downtrend
The stock market outlook remains in a downtrend, with geopolitical risks primed to inject volatility into financial assets.
Gold, Utilities, and Low Beta outperformed; Crypto, Financials, and Value underperformed. Producer prices came in higher than expected, which will sharpen the focus on this week’s employment data.
TREND ANALYSIS
The S&P500 ( $SPX ) slipped 0.4% last week, ending the back where it started:
- At the 50-day moving average
- ~5% above the 200-day moving average
The index tried to retake the 50-day moving average, but gave back the gains immediately, created another lower-high. All 3 technical indicators are now bearish:
- Average Directional Index: Bearish
- No change; remains bearish
- Institutional Activity: Bearish
- Price couldn’t hold the 50-day moving average
- 2 more distribution days brings the total to 7
- On-Balance Volume: Bearish
- Moved to bearish after falling below the average on a lower low
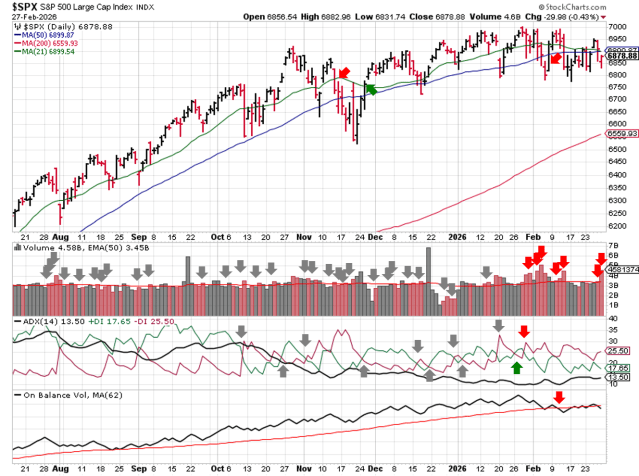
SPX Price & Volume Chart – 2026-03-01
PERFORMANCE HIGHLIGHTS & COMPARISONS
S&P500 Sectors
Utilities ( $XLU ) continue to outperform, gaining 3% last week and heading all comers by a wide margin. Financials ( $XLF ) underperformed. Communications ( $XLC ) rallied to back to bullish.
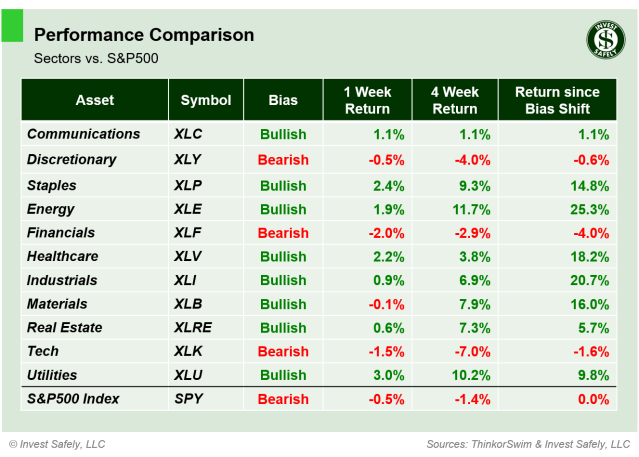
S&P Sector Performance – 2026-03-01
S&P500 Investing Styles
Low Beta ( $SPLV ) led styles higher; Small and Midcap Value ( $IWN, $IJJ ) lagged, giving back some of their recent gains. Momentum ( $MTUM ) fell back to neutral bias.
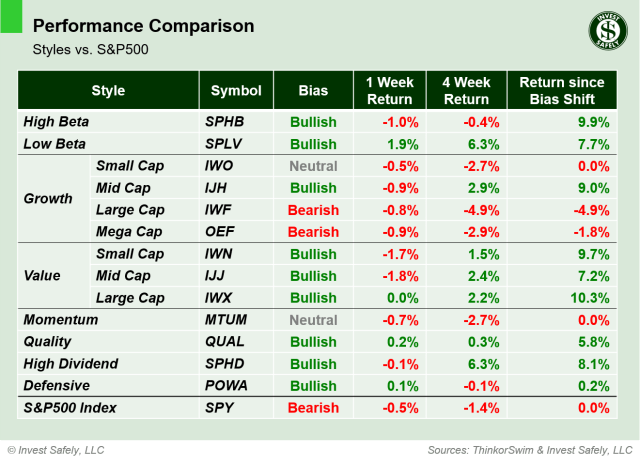
Sector Style Performance – 2026-03-01
Asset Classes
Gold ( $GLD ) was the best asset class last week, and is up more than 50% since turning bullish. Bitcoin ( $IBIT ) underperformed.
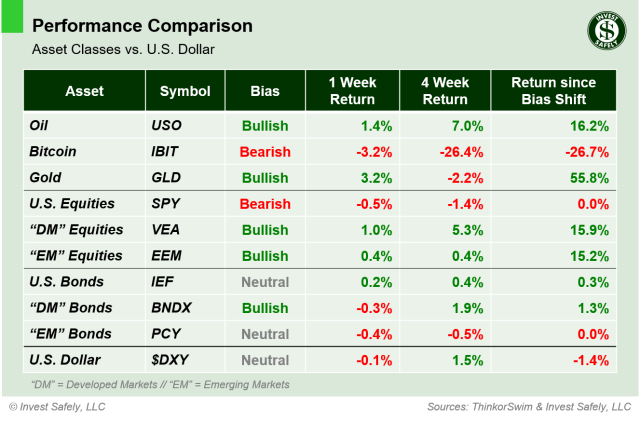
Asset Class Performance – 2026-03-01
COMMENTARY
Markets
Trading and investing in equities has been a slog so far this year. You’ve seen tickers slide back and forth between bullish and bearish bias, strong earnings met with big sells offs ( **cough** Nvidia **cough** ), and overnight gaps on after-hour headlines.
The Volatility Index ( $VIX ) spent almost the entire month of February on the cusp of the “chop zone”, confirming the difficult environment we’ve experienced.
Using a mechanical system, such as the example we use for the stock market outlook, can be frustrating when markets exhibit these characteristics. That’s one reason it’s important to diversify into other asset classes. It’s rare that they all move sideways at the same time, so there’s always another trade, like recent trends in gold and non-US equities.
Macroeconomic Data & Policy
Producer Prices ( PPI ) surprised to the upside: headline rose 1% year over year ( y/y ), while Core increased 2.4% y/y. Not exactly a welcome sign for those expecting rate cuts.
Regarding employment trends, one of the bigger stories was Block, Inc. ( $XYZ ) announcing a strategic shift toward artificial-intelligence-focused operating model. While most pundits expect AI to replace entry-level, white-collar positions, Block’s change came with a workforce reduction of almost 50%! And this is for a company doing well financially. Not exactly good news for the next employment cycle.
Geopolitics
Negotiations between U.S. and Iranian representatives stalled out during the week, resulting in military strikes during the weekend. Equity markets are likely to open down ( Sunday night futures ), with a massive volatility spike when New York trading opens on Monday. Oil and Gold are expected to open higher.
EYES ON THE HORIZON
The latest unemployment and jobs data hits the wires this week, along with ISM surveys. While these data points are likely to short-term, knee-jerk reactions, geopolitical headlines are now the dominant driver.
- Monday: ISM Manufacturing PMI
- Tuesday: —
- Wednesday: ADP Employment & ISM Services PMI
- Thursday: Unemployment Claims
- Friday: NFP & Retail Sales
Best to Your Week!


