
Stock Market Outlook: February 22th = Downtrend
The stock market outlook remains in a downtrend, though price has risen back to retest key levels.
Oil, Materials & Utilities, and High Beta outperformed; Consumer Staples lagged. PCE was higher than expected, while Q4 GDP came in low due to the government shutdown.
TREND ANALYSIS
The S&P500 ( $SPX ) rose 1.1% last week, as price traded back to key levels:
- At the 50-day moving average
- ~6% above the 200-day moving average
The index bounced after sweeping the lows near 6800, but was unable to clear the 21 and 50 day moving averages with any conviction.
- Average Directional Index: Bearish
- ADX direction indicators remain bearish
- Institutional Activity: Bearish
- Price returned to the 50 dma on average volume
- On-Balance Volume: Neutral
- On-balance volume is retesting its long-term average
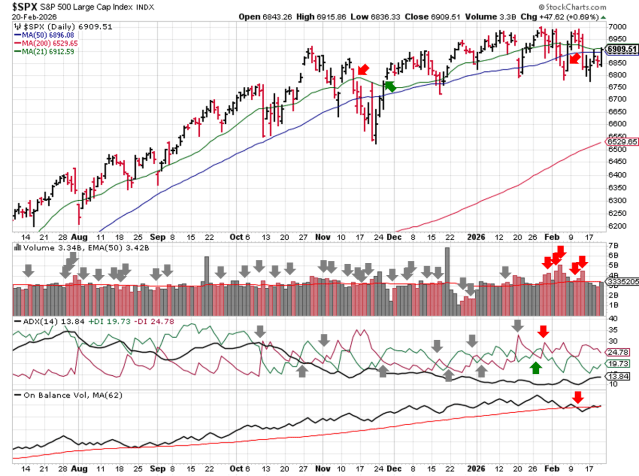
SPX Price & Volume Chart – 2026-02-22
PERFORMANCE HIGHLIGHTS & COMPARISONS
S&P500 Sectors
Materials ( $XLB ) outperformed, closely following by Utilities ( $XLU ). Consumer Staples ( $XLP ) underperformed. Communications ( $XLC ) clawed its way back to neutral.
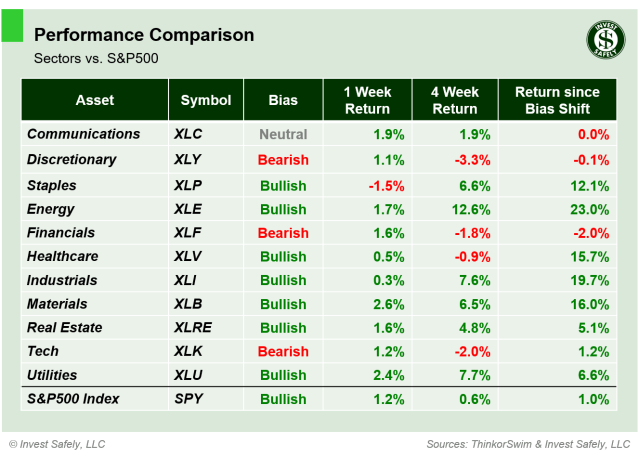
S&P Sector Performance – 2026-02-22
S&P500 Investing Styles
All investing styles ended the week in positive territory. High Beta ( $SPHB ) led the way and Mega Cap Growth, High Dividend, and Defensives ( $OWF, $SPHD, $POWA ) brought up the rear. Momentum ( $MTUM ) reclaimed a bullish bias.
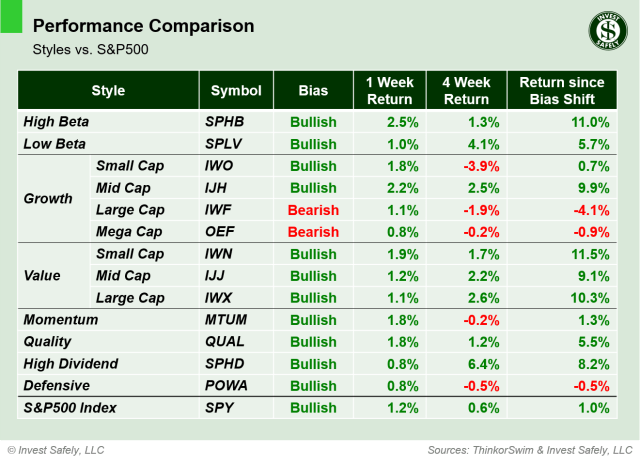
Sector Style Performance – 2026-02-22
Asset Classes
All asset classes gained ground last week, with Oil ( $USO ) gaining almost 6% and U.S. Bonds adding 0.1%. The U.S. Dollar ( $DXY ) strengthened to neutral bias after several weeks in bearish territory.
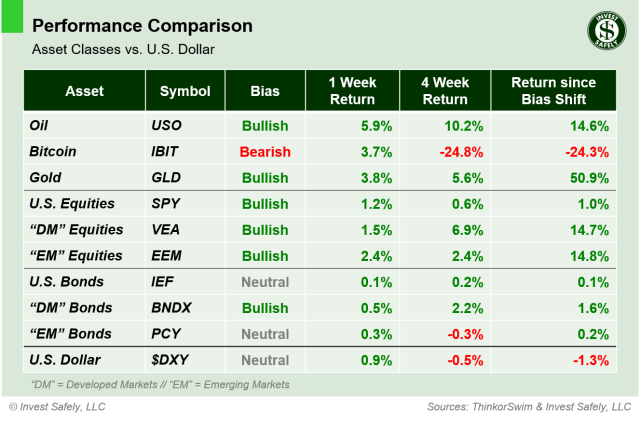
Sector Style Performance – 2026-02-22
COMMENTARY
Markets
Selling pressure took a breather last week; almost the entire dashboard registering a gain. Defensive positioning remains in control, although Consumer staples experienced some profit taking.
The Volatility Index ( $VIX ) spent another week testing the “chop zone” (a reading from 20 to 30), supporting the risk-off signals provided by price and volume.
Macroeconomic Data & Policy
New orders for durable goods fell 1.4% in January, which was a bit less than expected.
Headline PCE Price Index rose 2.9% YoY, up from 2.8% in November and driven by the cost of services. Core PCE rose 3.0% YoY, versus 2.8% in November.
Real GDP grew 1.4% in Q4 2025, a sharp slowdown from 4.4% in Q3 and lower than 1.9% in 2024 Q4. Government spending contracted ~5% due to the fall 2025 shutdown, bringing down the overall figure by almost 1%.
FOMC minutes showed a hawkish pause in place,, with most members wanting to hold rates steady until inflation shows further improvement.
The Supreme Court ruled 6–3 that President Trump’s tariff program exceeded presidential authority under the International Emergency Economic Powers Act (IEEPA). Within hours of the ruling, the Trump administration announced a new, 10% global tariff, citing authority under the Trade Act of 1974 instead of the IEEPA.
Geopolitics
The U.S. continues to build up military assets in the Middle East. Earlier in the week, there was some hope for an agreement as talks in Geneva resulted in some “guiding principles”. But the two sides remain far apart, per sources (Reuters.com: US and Iran slide towards conflict as military build-up eclipses talks).
EYES ON THE HORIZON
Several Fed members speak next week; PPI comes out Friday
- Monday: —
- Tuesday: 7 Fed Speeches
- Wednesday: —
- Thursday: —
- Friday: PPI
Best to Your Week!


