
Stock Market Outlook: February 15th = Downtrend
The stock market outlook remains in a downtrend after institutional selling sent price below key levels again.
Non-U.S. Developed Markets, Utilities, and and High Dividends outperformed; Bitcoin, Financials, and Mega-Cap Growth lagged. Non-farm payrolls were stronger than expected and inflation eased slightly.
TREND ANALYSIS
The S&P500 ( $SPX ) fell 1.4% last week, as price traded to and through key levels:
- ~1% below the 50-day moving average
- ~5% above the 200-day moving average
The index experience another volatile week, but failed to make a higher high. And then the technical indicators fell further into bearish territory.
- Average Directional Index: Bearish
-
- ADX direction indicators remain bearish
- The overall trend is still extremely weak
-
- Institutional Activity: Bearish
- Price broke below the 50 dma on elevated trading volume again
- 2 distribution days brings the total to 6
- On-Balance Volume: Bearish
- On-balance volume moved to bearish after closing below a long-term average
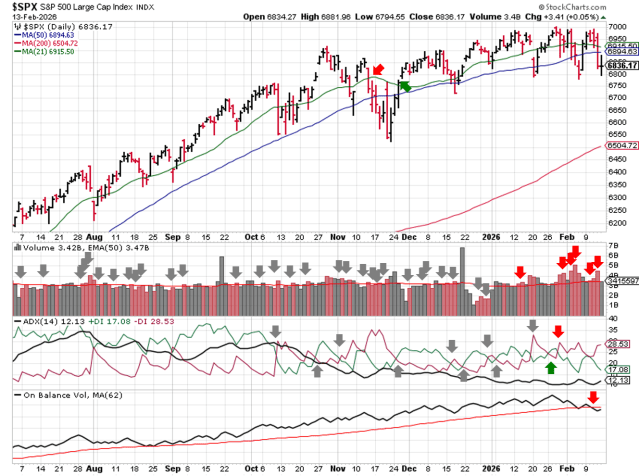
SPX Price & Volume Chart – 2026-02-15
PERFORMANCE HIGHLIGHTS & COMPARISONS
S&P500 Sectors
Utilities ( $XLU ) outperformed by a wide margin, while Financials ( $XLF ) underperformed. Communications and Financials ( $XLC, $XLF ) dropped to bearish bias, and Utilities ( $XLU ) ramped to bullish.
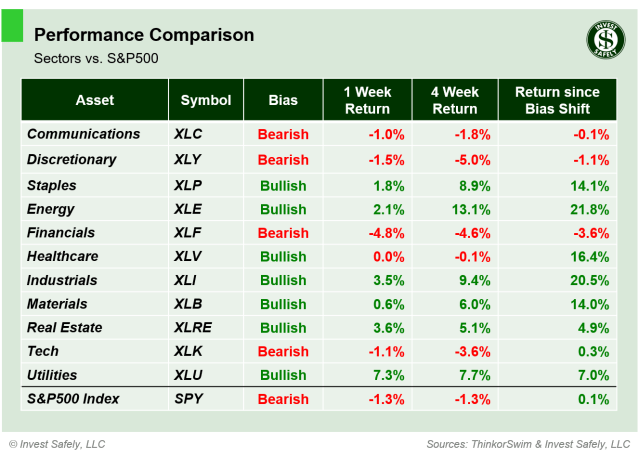
S&P Sector Performance – 2026-02-15
S&P500 Investing Styles
High Dividend stocks ( $SPHD ) led upside, and Mega Cap Growth ( $OWF ) headed the downside and fell back to bearish bias. Momentum ( $MTUM ) slipped to neutral.
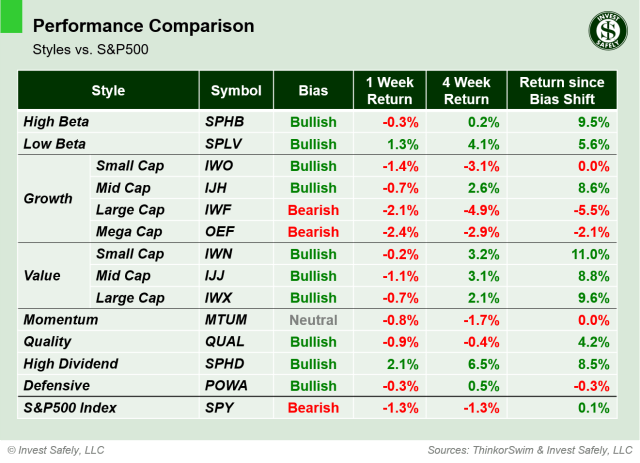
Sector Style Performance – 2026-02-15
Asset Classes
Non-U.S. Developed Markets ( $VEA ) led asset class returns to the upside, while Bitcoin ( $IBIT ) led to the downside. DM bonds ( $BNDX ) strengthened again, moving up to bullish bias. U.S. equities ( $SPY ) moved to bearish.
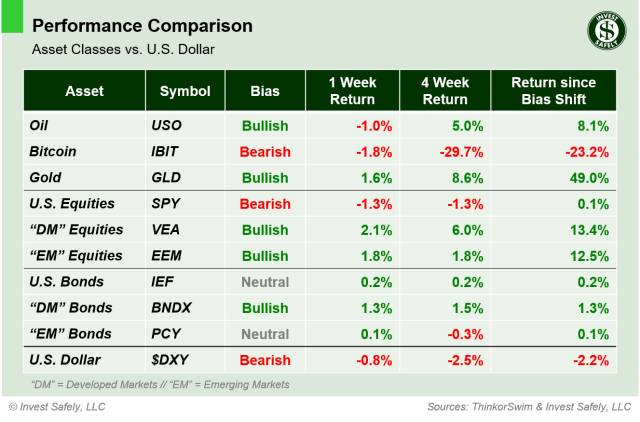
Asset Class Performance – 2026-02-15
COMMENTARY
Markets
U.S. equity sectors show the defensive posture of capital flows: strong performance in Industrials, Materials, Energy, Healthcare, and Staples. The breakout in Utilities, along with the move in Real Estate, benefited from a sharp drop in U.S. Treasuries.
The Volatility Index ( $VIX ) spent the week on the doorstep of Hedgeye’s “chop zone” (a reading from 20 to 30), supporting the general risk-off signals provided by price and volume.
Macroeconomic Data & Policy
Non-Farm Payrolls showed the U.S. added 130,000 jobs in January; above expectations for 70,000 and the Decembers increased of 48,000.
Existing home sales fell 4.4% YoY; the sharpest drop in ~4 years.
January headline CPI slowed from 2.7% to 2.4%; Core figures eased from 2.6% to 2.5%. Energy prices fell slightly, driven by a drop in gasoline prices.
Geopolitics
A quiet week, with no major geopolitical events influencing markets action.
EYES ON THE HORIZON
U.S. Markets are closed Monday for the Presidents Day Holiday. Chinese markets will be closed for an entire week (Monday, Feb 16 through Monday, Feb 23) for Lunar New Year Celebrations.
- Monday: U.S. Markets Closed
- Tuesday: n/a
- Wednesday: Housing Starts, Durable Goods, FOMC Minutes
- Thursday: n/a
- Friday: PCE
Best to Your Week!


