
Stock Market Outlook: February 8th = Downtrend
The stock market outlook shifted to a downtrend on Thursday, but may bullish biases remain intact. A continuation from Friday’s reversal will make the change short lived.
Gold, Consumer Staples, and Mid-Cap Value outperformed; Oil/bitcoin, Communications, and Large-Cap growth lagged. Macro data was mixed, and non-farm payroll data was delayed until this week, joining retail sales, and CPI.
TREND ANALYSIS
The S&P500 ( $SPX ) fell 0.1% last week, as price traded to and through key levels:
- ~1% above the 50-day moving average
- ~7% above the 200-day moving average
Last week’s volatility whipped around the technical indicators; 2 of 3 were bearish as of Thursday’s close, moving the outlook to a downtrend. Institutional activity recovered Friday; one more signal change is needed.
- Average Directional Index: Bearish
- ADX direction indicators remained bearish all week
- Institutional Activity: Bullish
- Price broke the 50 dma on elevated trading volume Thursday, moving the signal to bearish and shifting the outlook.
- Price recovered bullishly Friday morning, flipping the indicator back to bullish.
- On-Balance Volume: Neutral
- On-balance volume moved to neutral on Tuesday, testing it’s trendline for the first time since August
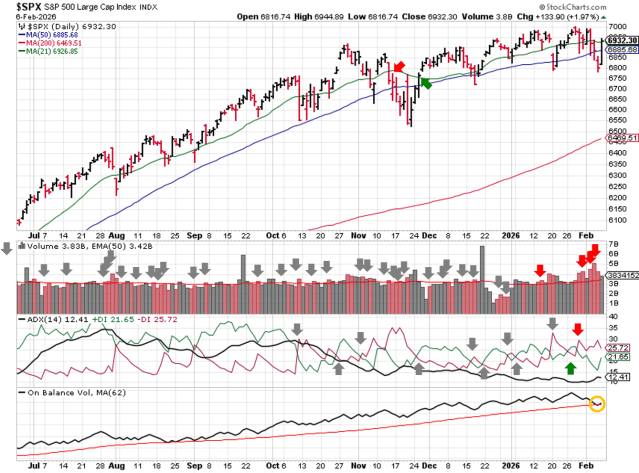
SPX Price & Volume Chart – 2026-02-08
PERFORMANCE HIGHLIGHTS & COMPARISONS
S&P500 Sectors
Consumer Staples ( $XLP ) outperformed, though several sectors kept pace. Communications ( $XLC ) underperformed. Consumer Discretionary and Technology ( $XLY, $XLK ) fell to bearish bias. Communications and Utilities ( $XLC, $XLU ) moved to neutral, and Financials ( $XLF ) moved back up to bullish.
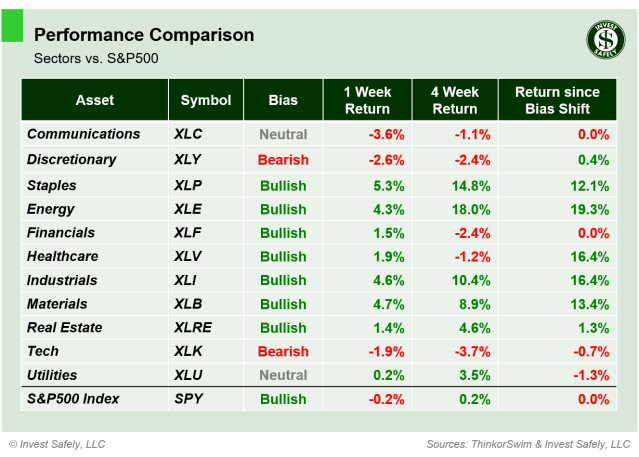
S&P Sector Performance – 2026-02-08
S&P500 Investing Styles
Mid-cap growth ( $IJH ) led upside performance, and Large Cap Growth ( $IWF ) was the worst style. Last week’s bias changes reversed: Mega Cap Growth ( $OEF ) returned to neutral bias, and Defensives ( $POWA ) to bullish.
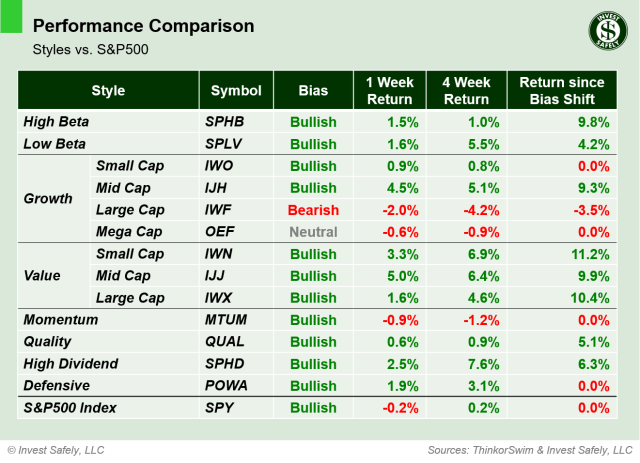
Sector Style Performance – 2026-02-08
Asset Classes
Gold ( $GLD ) led asset class returns. Oil reversed course from last week’s gains, but Bitcoin ( $IBIT ) was the biggest loser again. DM bonds ( $BNDX ) moved up to neutral bias, and EM bonds ( $PCY ) retreated to neutral.
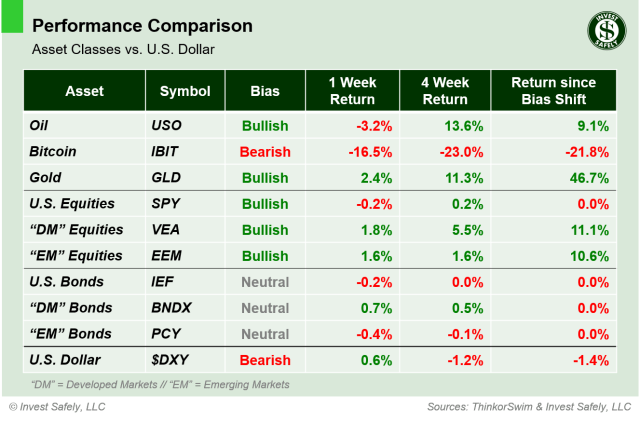
Asset Class Performance – 2026-02-08
COMMENTARY
Markets
Institutions were selling, but selectively. Index prices fell below key levels, then recovered. The S&P500 trend indicators flipped to bearish, but the $SPY bias is back to bullish. Some names broke out, some broke down. Talk about mixed messages.
- Traders sold large cap growth ( $IWF ) and technology stocks ( $XLC, $XLY, $XLK ).
- Traders bought Staples, Energy, Industrials, Materials ( $XLP, $XLE, $XLI, $XLB ) and value stocks ( $IWN, $IJJ, $IWX ).
Tech companies are the largest weights in general indexes, like the S&P500 and the Nasdaq 100, so their capital flows have an oversized impact on index price movement. Check out the equal weight version of the S&P500 ( $RSP ): price broke out to new highs on Friday!
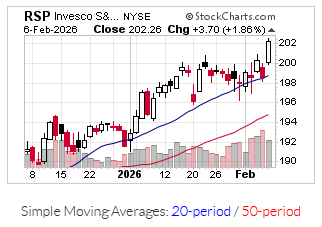
$RSP Price & Volume Chart – 2026-02-08
I’d say the market is mixed, the goal of these weekly exercises is preserving capital and reducing losses, so erring on the side of caution is the correct course of action. There is always another trade, but you have to have capital to participate.
Macroeconomic Data & Policy
January ISM Manufacturing PMI improved to 52.6%, representing the first expansion in 12 months. ISM Services PMI remained steady at 53.8%.
Job openings (JOLTs) fell year over year, signaling softer labor demand. And consumer sentiment was better than expected, but well below last year’s levels.
Non-farm payrolls were delayed a week due to the government shutdown.
Geopolitics
According to a U.S. trade representative, the U.S. is developing plans with Mexico, the European Union and Japan to implement minimum prices for critical, rare-earth minerals, triggering a sell-off in the sector.
The partial U.S. government shutdown ended last week.
EYES ON THE HORIZON
This week brings several important data releases:
- Monday: —
- Tuesday: Retail Sales
- Wednesday: Rescheduled NFP
- Thursday: Existing Home Sales
- Friday: CPI
Best to Your Week!


