
Stock Market Outlook entering the Week of December 14th = Uptrend
- Average Directional Index: Bearish
- Institutional Activity: Mixed
- On-Balance Volume: Bullish
ANALYSIS
The stock market outlook shows an uptrend as we head into the final trading days of 2025.
The S&P500 ( $SPX ) rose 0.1% last week. The index sits 1% above the 50-day moving average and ~10% above the 200-day moving average.
The ADX directional indicators moved to bearish last week, but the main average is low and headed lower, showing a market without trend. The market sliced through the 21-day and 50-day moving averages on higher volume (bearish), but recovered those levels the next day (potentially bullish). Friday’s volume was generated by the largest option’s expiration ever, so not a lot of signal there either. So the outlook stays in an uptrend until price and volume decide to pick a direction.

SPX Price & Volume Chart for Dec 21 2025
PERFORMANCE COMPARISONS
Consumer Discretionary ( $XLY ) outperformed last week, one of a handful of sectors to end the week in the green. Energy ( $XLE ) underperformed significantly, and also dropped back to bearish bias.

S&P Sector Performance from Week 51 of 2025
Momentum ( $MTUM ) led the sector style breakdown, but there wasn’t much to get exited about for bullish investors. Small Cap Value ( $IWN ) led to the downside. s the largest loser, again thanks to AI worries. Momentum ( $MTUM ) shifted again, back to bullish bias this time. Low beta ( $SPLV ) downshifted back to bearish.
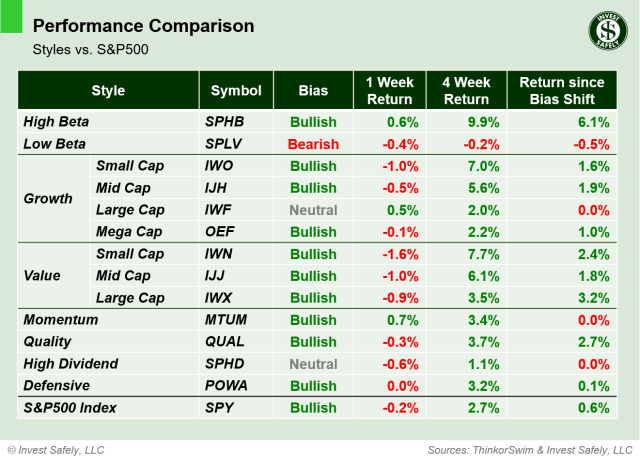
Sector Style Performance from Week 51 of 2025
Bitcoin ( $IBIT ) was the worst asset class last week, and gold ( $GLD ) outperformed. The U.S. dollar ( $DXY ) managed to regain neutral bias.
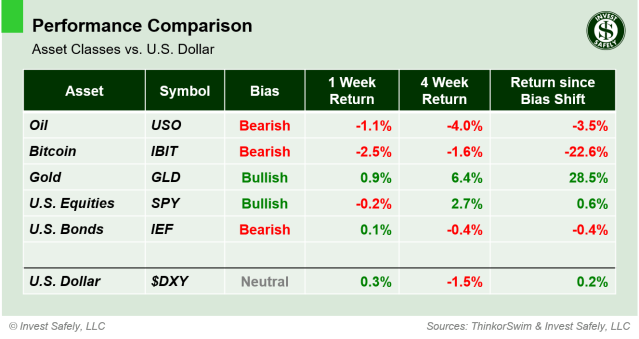
Asset Class Performance from Week 51 2025
COMMENTARY
The October NFP report showed a decrease in jobs (-105k vs. +108k Sept & +44k Oct 2024), but wasn’t all that surprising given the government shutdown’s impact on numbers. November NFP did the opposite, far outpacing Octobers loss (+64k), but was well below last year’s November number of +261k.
November CPI came in below estimates, but there was A LOT of missing data, so it’s hard to get really excited about the improvement.
| CPI (y/y) | Actual | Prior |
Expected |
| Headline | +2.7% | — | +3.1% |
| Core | +2.6% | — | +3.0% |
Trading activity should be well below normal levels for the next two weeks, with the arrival of Christmas and New Year’s holidays. Low activity also means low liquidity, which could make any surprise even more jarring. Hopefully it’s to the upside! But given the mixed messages from macroeconomic and technical analysis, it’s not a bad idea to place some stops at any key levels you’ve been eyeing, just in case.
Markets close early on Wednesday, remain closed on Thursday, and then reopen for Friday to close out the week. The following week will also feature shortened trading hours thanks to New Years Day. So this will be the last post for the year; the next outlook will be on Jan 4 2026.
May your holidays be filled with joy, peace, and love, and I wish you much happiness and prosperity in the year ahead.
Merry Christmas!
P.S. If you find this research helpful, please tell a friend.
If you don’t, tell an enemy.


