
Stock Market Outlook entering the Week of December 7th = Uptrend
- Average Directional Index: Bullish
- Institutional Activity: Mixed
- On-Balance Volume: Bullish
ANALYSIS
The stock market outlook shows an uptrend, with the market looking forward to this week’s FOMC meeting.
The S&P500 ( $SPX ) rose 0.3% last week. The index sits ~1% above the 50-day moving average and ~10% above the 200-day moving average.
No change in the signals this week; the ADX and On-Balance Volume are bullish, while institutional activity is still mixed.
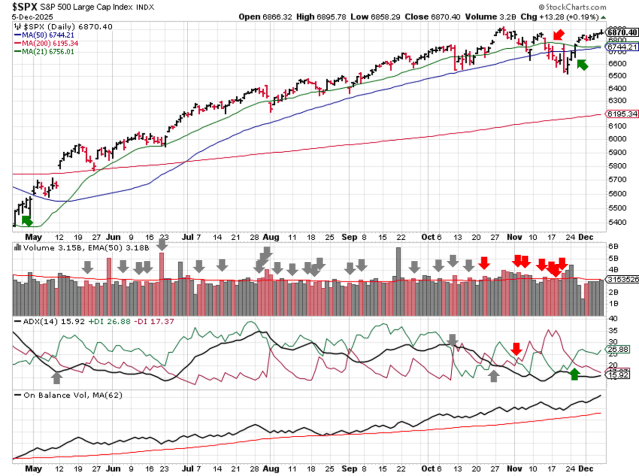
SPX Price & Volume Chart for Dec 07 2025
PERFORMANCE COMPARISONS
Technology ( $XLK ) outperformed last week. Utilities ( $XLU ) led the to downside and shifted to bearish bias. Real Estate ( $XLRE ) also fell to Bearish, Staples and Materials ( $XLP & $XLB ) downshifted to Neutral. Communications and Discretionary ( $XLC & $XLY ) moved from Neutral to Bullish.
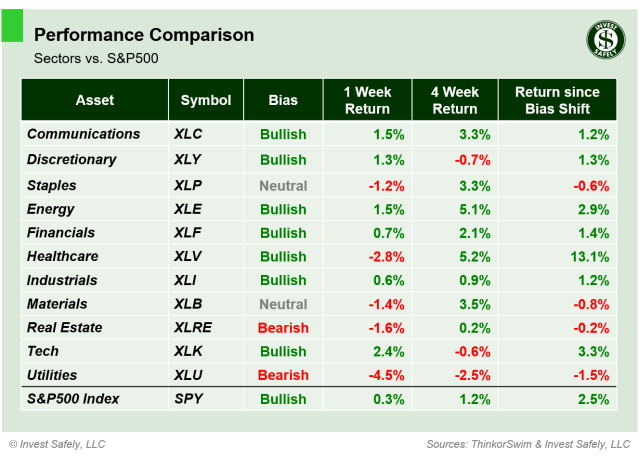
S&P Sector Performance from Week 49 of 2025
High Beta ( $SPHB ) investing style was the largest gainer, and Low Beta ( $SPLV ) was the largest loser. Momentum ( $MTUM ) shifted back into bullish bias; Low Beta and High Dividend ( $SPLV & $SPHD ) styles moved to bearish.
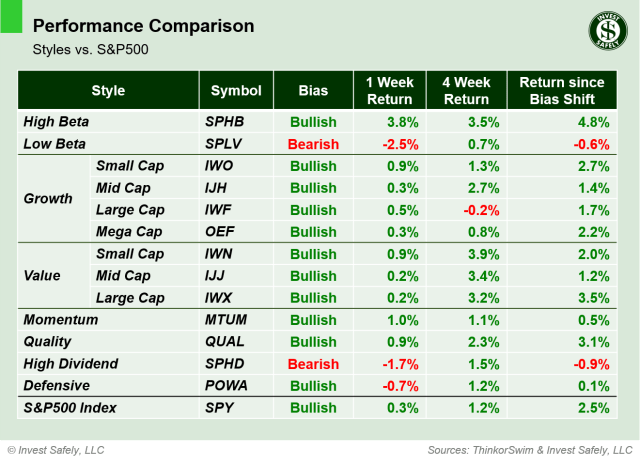
Sector Style Performance from Week 49 of 2025
Oil ( $USO ) was the best asset class last week. After a rough stretch, Oil moved up to Neutral bias, signaling potential bullish price action ahead. Bitcoin ( $IBIT ) underperformed. Bonds and the US dollar ( $IEF & $DXY ) also moved to neutral bias.

Asset Class Performance from Week 49 2025
COMMENTARY
Trading volume was muted last week; no surprise for the start of the holiday season. But that means we’re still waiting for institutional activity to confirm a new rally.
November’s ISM Manufacturing PMI fell to 48.2, which was lower than estimates, October data, and on a year-over-year basis. Services PMI rose to 52.6 in November, above forecasts and October data, and matching last year.
September PCE data was inline with estimates, and remains “sticky”.
| PCE (y/y) | Actual | Prior |
Expected |
| Headline | +2.8% | +2.7% | +2.8% |
| Core | +2.8% | +2.9% | +2.9% |
This week, JOLTS for September and October are set for release on Tuesday, followed by another FOMC interest rate decision on Wednesday.
Best to Your Week!
P.S. If you find this research helpful, please tell a friend.
If you don’t, tell an enemy.


