
Stock Market Outlook entering the Week of November 16th = Uptrend
- Average Directional Index: Bearish
- Institutional Activity: Mixed
- On-Balance Volume: Bullish
ANALYSIS
The stock market outlook shows an uptrend for U.S. equities, but the index hasn’t overcome recent technical weakness.
The S&P500 ( $SPX ) rose 0.1% last week. The index sits at the 50-day moving average and ~10% above the 200-day moving average.
Same breakdown, different week. The ADX is bearish. Institutional activity shows elevated selling ( 5 distribution days ), but price recovered to 50-day moving average by Friday’s close, so the indicator is mixed. On Balance Volume is bullish. Since technical indicators haven’t confirmed any changes, the overall outlook remains bullish.
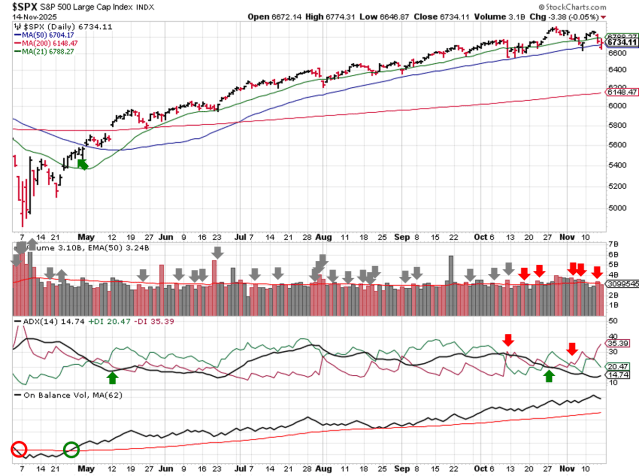
SPX Price & Volume Chart for Nov 16 2025
PERFORMANCE COMPARISONS
Healthcare ( $XLV ) led sectors higher for the second week in a row. Consumer Discretionary ( $XLY ) not only underperformed, but also fell from neutral to bearish bias. Industrials ( $XLI ) also dropped to bearish.

S&P Sector Performance from Week 46 of 2025
Small Cap Growth ( $IWO ) significantly underperformed, while Low Beta ( $SPLV ) outperformed. Small Cap Growth and Value, along with Quality ( $IWO, $IWN, $QUAL ) moved from Neutral to Bearish.
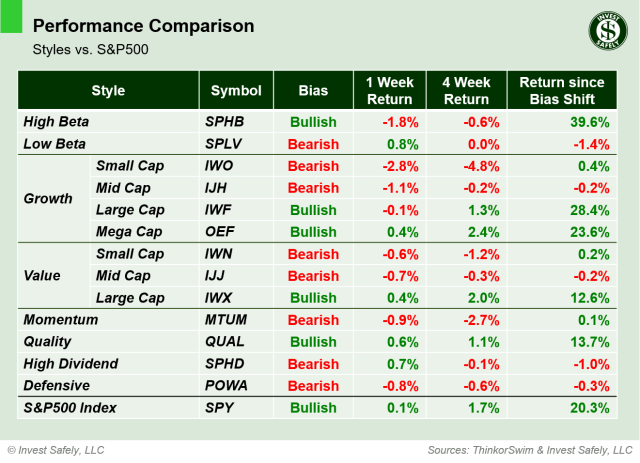
Sector Style Performance from Week 46 of 2025
Gold ( $GLD ) regained some of its luster and led assets higher. Bitcoin ( $IBIT ) underperformed by a wide margin, dropping more than 9% and continuing the recent sell-off. There were no changes to bias.

Asset Class Performance from Week 46 2025
COMMENTARY
Another week, another save by a Friday bounce from the 50-day moving average. The S&P500 is still up 20% since turning bullish earlier this year, but has only managed to rally ~2% over the past month. More than half of the sectors are bearish, and the same can be said for sector styles.
If you’re bullish, you’re hoping that price has been consolidating while institutions rebalance their holdings, ahead of a Santa Claus rally to end the year. If you’re bearish, you’re seeing a topping process as institutions lock-in profits by selling Technology and Large/Mega cap growth to retail investors. Hopefully, you’re neither and just watching price to signal a direction. It’s possible for both narratives to be correct.
The longest U.S. government shutdown, with funding secured through January 30, 2026. So we might have to do this all over again in about 2 months. 4th quarter GDP will be negatively impacted, but we won’t know how much until next year.
Speaking of data, we should see data releases return to their normal schedules as well. This week we get FOMC minutes on Wednesday, existing homes sales on Thursday, and another round of Fed speeches. And don’t forget Nvidia ( $NVDA ) earnings on Wednesday after market close.
Best to Your Week!
P.S. If you find this research helpful, please tell a friend.
If you don’t, tell an enemy.


