
Stock Market Outlook entering the Week of October 5th = Uptrend
- Average Directional Index: Uptrend
- Institutional Activity: Uptrend
- On-Balance Volume: Uptrend
ANALYSIS
The stock market outlook continues to show an uptrend for U.S. equities.
The S&P500 ( $SPX ) rose 1.1% last week. The index sits ~3% above the 50-day moving average and ~11% above the 200-day moving average.
All three indicators are bullish.

SPX Price & Volume Chart for Oct 05 2025
PERFORMANCE COMPARISONS
Healthcare ( $XLV ) was up ~7% last week(!), besting all other sectors by a wide margin. After it’s recent run up, Energy ( $XLE ) lost some of it’s momentum, thanks in part to Crude Oil, and registered the weakest returns. Healtcare and Real Estate ( $XLRE ) improved to Bullish bias, while Materials ( $XLB ) slipped to neutral.
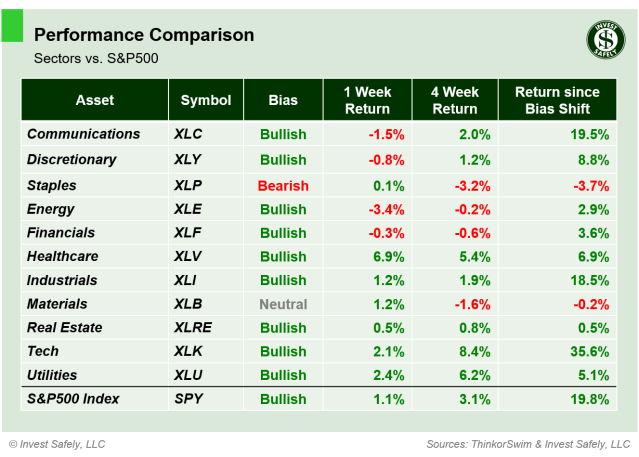
S&P Sector Performance from Week 40 of 2025
High Beta ( $SPHB ) outperformed last week, with Small Cap Growth and Quality ( $IWO & $QUAL ) right behind. Momentum ( $MTUM ) was the only losing style. High Dividend ( $SPHD ) moved back to bullish bias from neutral.
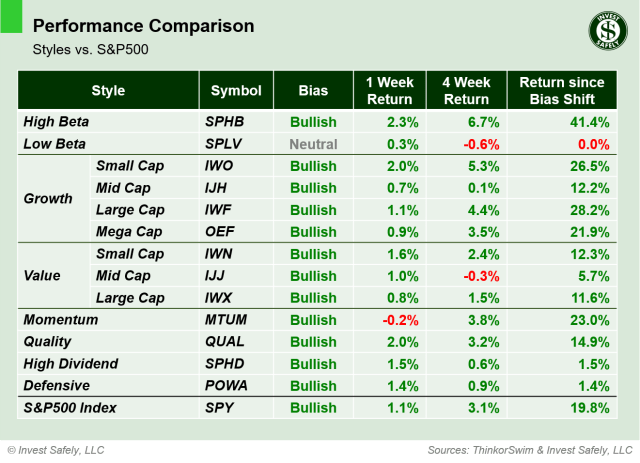
Sector Style Performance from Week 40 of 2025
Bitcoin ( $IBIT ) got its mojo back, jumping ~13%, and reclaimed bullish bias. On the other hand, Oil ( $USO ) dropped ~7% last week and returned to bearish bias…just one week after popping ~5% moving to bullish.

Asset Class Performance from Week 40 2025
COMMENTARY
Last week’s data releases showed August job openings ( JOLTs ) increased slightly. The ISM Manufacturing survey show a small improvement as well, while services were a bit lower. The main course, Non-Farm Payrolls, wasn’t released due to the U.S. government shutdown, so other tea leaves need reading prior to the next FOMC meeting.
While there’s been a lot of noise about interest rates and unemployment, the general indexes continue to march higher. Even a bit of volatility below the surface of the market (in terms of sectors and styles) hasn’t done much to slow it’s advance.
Best to Your Week!
P.S. If you find this research helpful, please tell a friend.
If you don’t, tell an enemy.


