
Stock Market Outlook entering the Week of May 18th = Uptrend
- ADX Directional Indicators: Uptrend
- Institutional Activity (Price & Volume): Uptrend
- On Balance Volume Indicator: Uptrend
ANALYSIS
The stock market outlook stays in an uptrend, as equities rallied out of a short consolidation.
The S&P500 ( $SPX ) gained 5.3% last week. The index sits ~7% above the 50-day moving average and ~3% above the 200-day moving average, roughly the same position as last Sunday.

SPX Price & Volume Chart for May 18 2025
All three technical indicators are bullish. The Direction Indicator ( ADX ) flipped on the gap higher Monday.
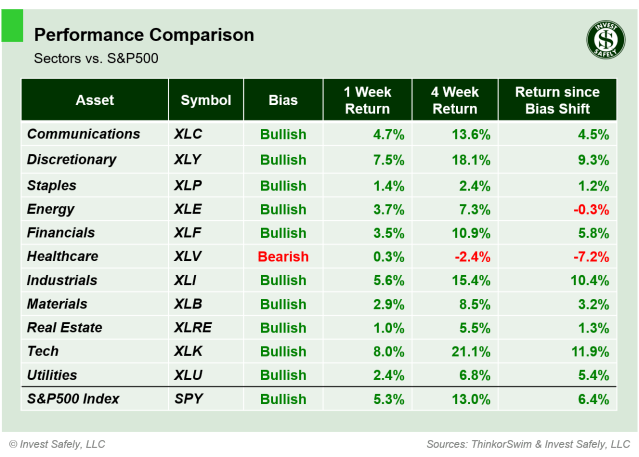
S&P Sector Performance for Week 21 of 2025
Technology ( $XLK ) led the way last week, up an amazing 8%. Healthcare ( $XLV ) was the worst sector again. Consumer Staples ( $XLP ) and Energy ( $XLE ) jumped up to bullish, leaving Healthcare ( $XLV ) as the lone bearish sector

Sector Style Performance for Week 21 of 2025
High Beta ( $SPHB ) was the best style again last week, and is up 14% since turning bullish. The lowest performer was Low Beta ( $SPLV ) with a 1.5% gain. Mega-cap Growth, Small and Mid-cap Value, Quality and high Dividend ( $OEF, $IWN, $IJJ, $QUAL, $SPHD ) all improved to bullish bias.
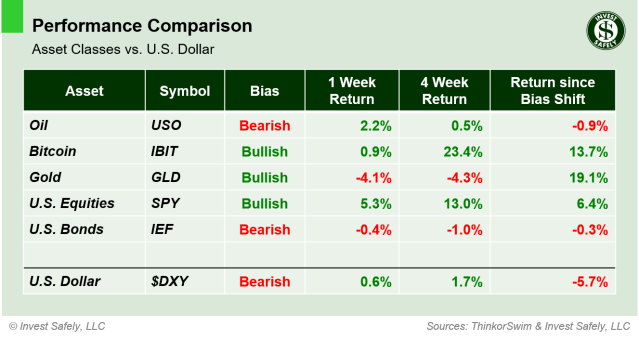
Asset Class Performance for Week 21 2025
U.S. Equities ( $SPY ) led assets higher. Gold ( $GLD ) was the worst performer. In terms of bias, U.S. bonds continue to weaken on higher interest rates, pushing $IEF down into bearish bias.
COMMENTARY
Equity indexes gapped higher on the open Monday, in response to the U.S. and China trade deal details, and closed higher every session. The only downside is that stocks are back in overbought territory!
Consumer Price data shows headline inflation fell in April, while core remained flat; price increases from tariffs haven’t made their way through supply chains yet. On top of those data points, both measures had their March figures revised lower as well.
| CPI (y/y) | Actual | Prior |
Expected |
| Headline | +2.3% | +2.4% | +2.4% |
| Core | +2.8% | +2.8% | +2.8% |
As far as producers were concerned ( PPI ) , headline and core fell in April. But, as expected, March data was revised significantly higher ( +0.7% for both headline and core ). I’d expect the impact of tariffs to start showing up in May and June readings, but only slightly due to the pauses put in place.
| PPI (y/y) | Actual | Prior |
Expected |
| Headline | +2.4% | +3.4% | +2.5% |
| Core | +3.1% | +4.0%* | +3.1% |
After market’s closed on Friday, Moody’s downgraded the United States credit rating, from Aaa to Aa1, citing growing government debt. There was a lot of ink/electrons spilled over the weekend on the subject, but the decision is inline with earlier decisions by the 2 other rating agencies: Standard & Poor’s downgraded the U.S. in August 2011, and Fitch in August 2023. All 3 still give the U.S. their 2nd highest rating. In terms of a market response, the initial reaction probably sends rates higher and equities/bonds lower in the pre-market session.
Best to Your Week!
P.S. If you find this research helpful, please tell a friend.
If you don’t, tell an enemy.


