
Stock Market Outlook entering the Week of April 27th = Downtrend
- ADX Directional Indicators: Downtrend
- Institutional Activity (Price & Volume): Uptrend
- On Balance Volume Indicator: Neutral
ANALYSIS
The stock market outlook remains in a downtrend as we wait for another indicator to turn bullish.
The S&P500 ( $SPX ) ) rose 4.6% last week. As of Friday, the S&P500 reached a key support-turned-resistance level, sitting ~2% below the 50-day moving average and ~4% below the 200-day moving average.
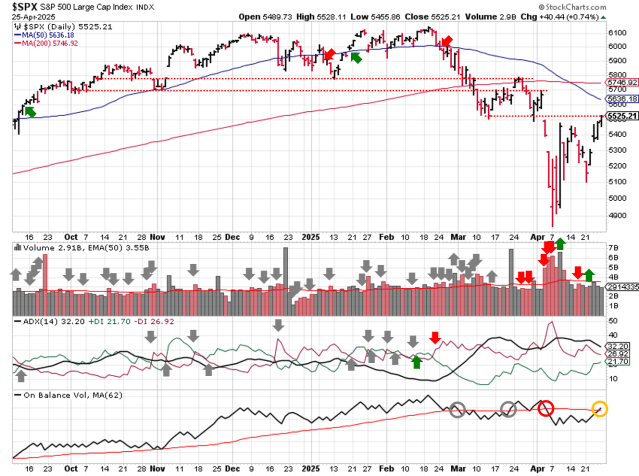
SPX Price & Volume Chart for Apr 27 2025
The Direction Indicator ( ADX ) remains bearish to start the week. Institutional activity moved into an uptrend last Tuesday. Trading volume wasn’t spectacular, so extra caution is warranted and the index still needs to regain the 50-day moving average. On-Balance volume ( OBV ) hit the trendline on Friday and needs another day to confirm the change to an uptrend.

S&P Sector Performance for Week 18 of 2025
Technology ( $XLK ) was the best sector last week, erasing almost half it’s loss since turning bearish. Consumer Staples ( $XLP ) was the worst performer, the only sector to register a loss, and it went back to Neutral bias. Utilities ( $XLU ) improved to Bullish, while the other sectors need a bit upside more before flipping.
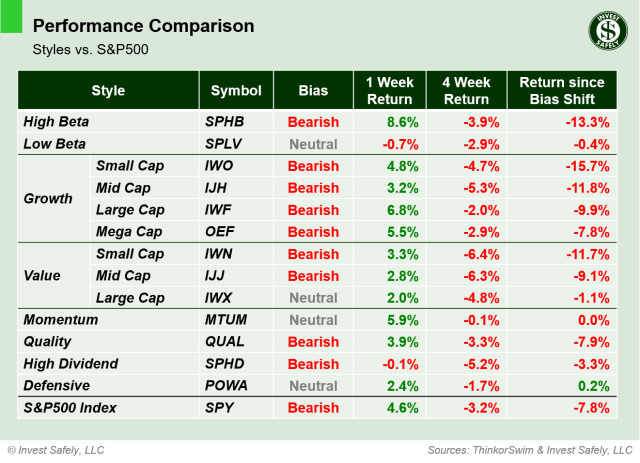
Sector Style Performance for Week 18 of 2025
High Beta ( $SPHB ) was the best performing style last week; Low Beta ( $SPLV ) the worst. Large Cap Value, Momentum, and Defensives ( $IWX, $MTUM, $POWA ) joined Low Beta with a neutral bias, while the other styles remain bearish.
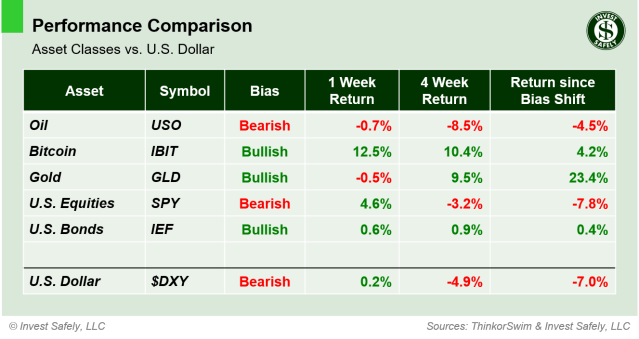
Asset Class Performance for Week 18 2025
Bitcoin ( $IBIT ) soared last week, while Oil ( $USO ) and Gold ( $GLD ) gave back some of their recent gains. Bitcoin and Bonds ( $IEF ) shifted from neutral to bullish bias, although bonds have waffled recently.
COMMENTARY
While the overall market outlook is on the verge of signaling an uptrend, recent gains still appear to be part of a counter-trend rally. A majority of the sectors and styles aren’t bullish bias yet, overall trading volume has been below average, and there’s a limited number of high quality growth stocks breaking out of quality price patterns. Stocks that were showing signs of strength, such as Consumer Staples, fell victim to profit taking last week.
Macro-wise, outside of any potential tariff, geopolitical, or Federal Reserve related headlines, the market will need to digest quite a few earnings releases this week, along with March jobs data, March PCE, and the first Q1 GDP estimate.
I wouldn’t be at all surprised to see the index reach the 5600 level and retest its 50-day moving average this week, as that is a typical price pattern after a volatile sell-off. That’s also the level required to shift the index to a bullish bias and move out of counter-trend rally territory. Keep in mind almost all equities are already overbought at the current levels, so reducing some exposure as we approach resistance is prudent; much like the set-up for gold heading into last week.
Best to Your Week!
P.S. If you find this research helpful, please tell a friend.
If you don’t, tell an enemy.


