
Stock Market Outlook entering the Week of March 30th = Downtrend
- ADX Directional Indicators: Downtrend
- Institutional Activity (Price & Volume): Downtrend
- On Balance Volume Indicator: Neutral
ANALYSIS
The stock market outlook remains in a downtrend as we close out Q1.
The S&P500 ( $SPX ) fell 1.5% last week. The index is ~5% below the 50-day moving average and ~3% below the 200-day moving average.
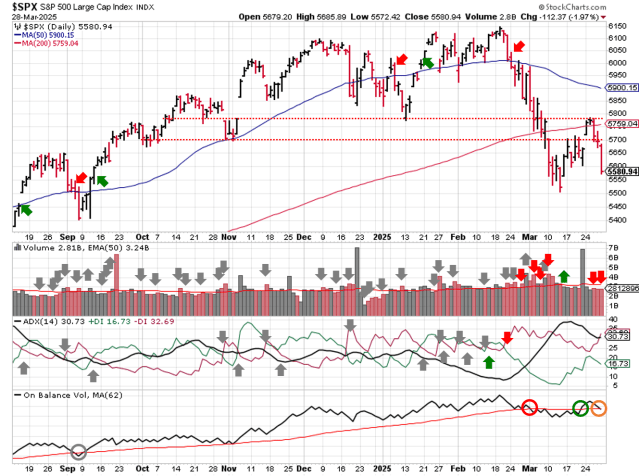
SPX Price & Volume Chart for Mar 30 2025
The Average Directional Index ( ADX ) remains bearish. On-Balance Volume ( OBV ) moved back to it’s trendline, so the signal shifts back to neutral.
Institutional investors wouldn’t or couldn’t provide a follow-through day for the currently rally attempt; the 3/24 move didn’t have enough trading volume and prices immediately retreated from resistance. It’s still possible we get a follow-through day this week, but distribution days between the start of a rally and the follow-through are never a good sign and we had 2 last week.
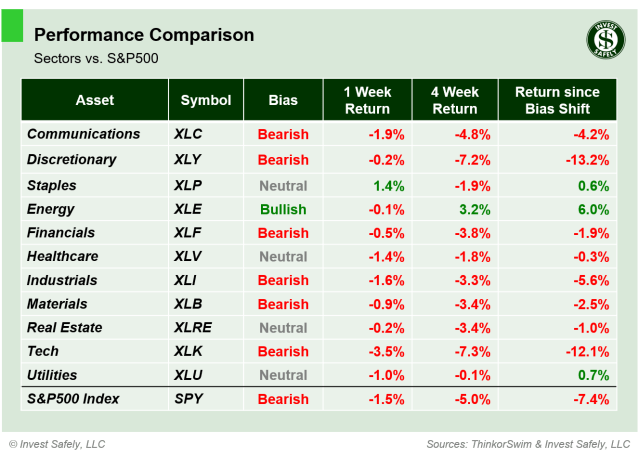
S&P Sector Performance for Week 14 of 2025
Consumer Staples ( $XLP ) was the only sector to secure a gain last week, while Technology ( $XLK ) led to the downside. Consumer Staples, Health Care, and Utilities ( $XLP, $XLV, $XLU ) moved to Neutral bias.

Sector Style Performance for Week 14 of 2025
Low beta ( $SPLV ) provided some shelter from last week’s selling, while High Beta sold off hard ( $SPHB ). Not changes in bias and still a bearish picture overall.
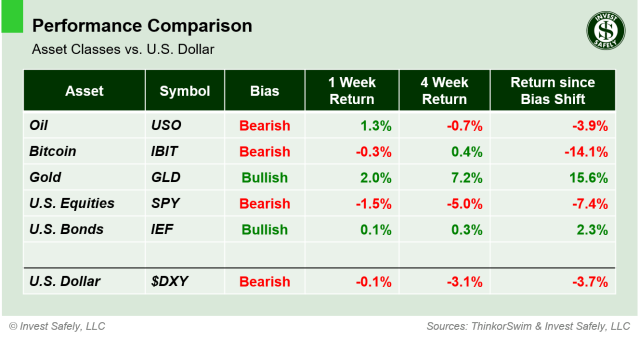
Asset Class Performance for Week 14 2025
Gold ( $GLD ) was the best performing asset last week, while U.S. equities ( $SPY ) were the worst. No change in bias; defensive assets remain the strongest.
COMMENTARY
Leading off with a a bit of housekeeping: corrected an issue with the performance tables, specifically the “Returns since Bias Shift” for the Bearish designation. A minor issue, but after review, one that provides a great reminder to avoid deploying capital into bearish sectors, styles, and asset classes!
The latest rally attempt did, in fact, reveal itself to be a counter-trend bounce:
Until we see more shifts to bullish bias by sectors and styles, as well as breakouts by individual growth stocks, consider the recent move as a counter-trend bounce.
2024 Q4 GDP got a slight increase for the final estimate, coming in at +2.4%. Unfortunately, that means slowing growth, since it’s 0.8% lower than Q4 2023. Q1 2025 GDP is likely to “disappoint” again, coming in around 1% (for reference, 2024 Q1 was 1.6%).
February PCE showed no movement in the headline data. Core came in at 2.8%, higher than January’s 2.7%*, which was also adjusted higher from 2.6%. So inflation remains “sticky”, and that’s prior to any potential impact from new tariffs.
| PCE (y/y) | Actual | Prior |
Expected |
| Headline | +2.5% | +2.5% | +2.5% |
| Core | +2.8% | +2.7%* | +2.6% |
This week, we get job and survey data, in the form of ISM PMI results, JOLTS, and Non-Farm Payrolls. From a volatility perspective, the big event this week comes on Wednesday (April 2), when the current administration is expected to announce an updated trade policy, centered on reciprocal tariffs. There’s been a lot of mixed messaging leading up to the event, and you know how market participants react to uncertainty…they hedge and /or sell. And remember those 25% tariffs on Mexican and Canadian imports? April 2 is the expiration date for those as well.
With slowing economic growth, sticky inflation, and the threat of tariffs exacerbating both, don’t be surprised when you hear talk of “stagflation”, or even the “R” word (i.e. recession), hitting the airwaves in April. But by that time, it’ll be old news, since U.S. equities showed their hand back in February. Instead, use your time to manage your portfolio, making sure you’ve got minimal exposure to bearish trends, while maximizing allocations to assets, sectors, and styles that are moving to and sustaining a bullish bias. Currently, that’s investments in precious metals, European equities, or U.S. bonds.
Best to Your Week!
P.S. If you find this research helpful, please tell a friend.
If you don’t, tell an enemy.


