
Stock Market Outlook entering the Week of December 1st = Uptrend
- ADX Directional Indicators: Uptrend
- On Balance Volume Indicator: Uptrend
- Institutional Activity (Price & Volume): Uptrend
ANALYSIS
The stock market outlook starts the final month of 2024 in an uptrend.
The S&P500 ( $SPX ) rose 1.5%. The index sits ~3% above the 50-day moving average and ~11% above the 200-day moving average.

SPX Price & Volume Chart for Dec 01 2024
The ADX ( Average Directional Index ), Institutional Activity and OBV ( On-Balance Volume ) are all in bullish territory.
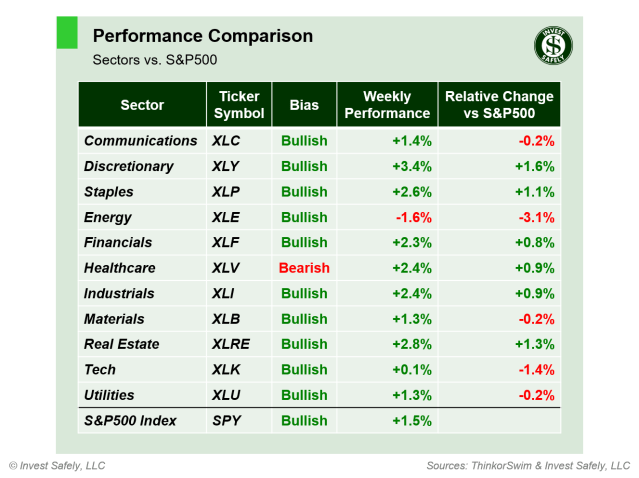
S&P Sector Performance for Week 48 of 2024
Most sectors rallied, with Consumer Discretionary ( $XLY ) leading the way. Energy ( $XLE ) was the worst performer with a 1.6% loss. Longer-term, Consumer Staples ( $XLP ), Materials ( $XLB ), and Real Estate ( $XLRE ) regained bullish trends.
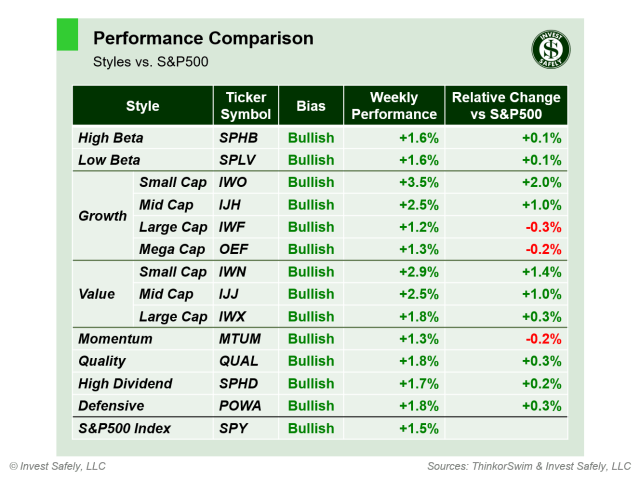
Sector Style Performance for Week 48 of 2024
Small Cap Growth ( $IWO ) led sector styles higher for the second weak in a row. On the lower end of the performance spectrum while Large Cap Growth ( $IWF ), Mega Cap Growth ( $OEF ), and Momentum ( $MTUM ) couldn’t match the general market gains, but still closed up for the week. All sector styles have a bullish bias.
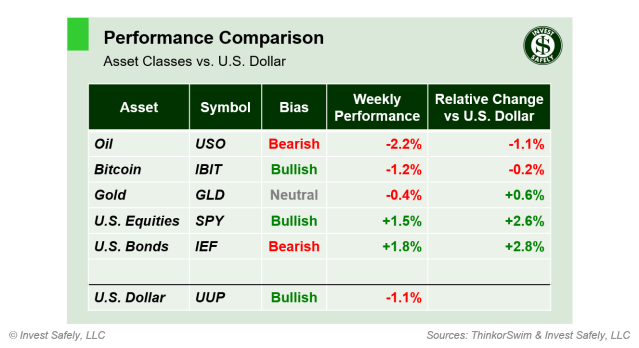
Asset Class Performance for Week 48 2024
Bonds ( $IEF ) led the way last week, while Oil ( $USO ) was the worst performer. Commodities are struggling to regain bullish trends in the midst of geopolitical turmoil; oil returned to a bearish trend 1 week after a bullish flip and gold retreated slightly to a neutral trend designation.
COMMENTARY
The FOMC minutes were a nothing-burger, as was the 2nd estimate of Q3 GDP (no change).
Headline PCE for October rose slightly versus September, though it was below last year’s 3% figure. Core PCE also rose to the highest level since June.
| PCE (y/y) | Actual | Prior |
Expected |
| Headline | +2.3% | +2.1% | +2.3% |
| Core | +2.8% | +2.7% | +2.8% |
This week, November ISM Manufacturing & Services PMI hit the wires, along with the latest JOLTs and NFP figures. Black Friday and Cyber Monday sales estimates could also influence price action in the retail sector.
Best to Your Week!
P.S. If you find this research helpful, please tell a friend.
If you don’t, tell an enemy.


