
Stock Market Outlook entering the Week of November 17th = Uptrend
- ADX Directional Indicators: Neutral
- On Balance Volume Indicator: Uptrend
- Institutional Activity (Price & Volume): Uptrend
ANALYSIS
The stock market outlook remains in an uptrend, despite the small correction last week.
The S&P500 ( $SPX ) fell 2.1%. The index sits ~2% above the 50-day moving average and ~9% above the 200-day moving average.

SPX Price & Volume Chart for Nov 17 2024
The ADX ( Average Directional Index ) shifted to neutral on Friday, with the directional indicators (DI+ / DI-) ending the session at roughly the same value. Institutional Activity and OBV ( On-Balance Volume ) remain in bullish territory.

S&P Sector Performance for Week 46 of 2024
Financials ( $XLF ) and the energy sector ( $XLE ) were the biggest movers, as well as the only sectors to remain positive for the week. Healthcare ( $XLV ) was the worst performer, dropping almost 6%. Longer-term, Materials ($XLB ) and Real Estate ($XLRE ) shifted to a bearish bias, joining Staples and Healthcare.

Sector Style Performance for Week 46 of 2024
None of the sector styles managed a gain last week. Low Beta ( $SPLV ) was the least bad, while last week’s best performer, Small Cap Growth ( $IWO ), was the worst performer this week. Longer-term, the High-Dividend sector style ( $SPHD ) shifted to a neutral bias.
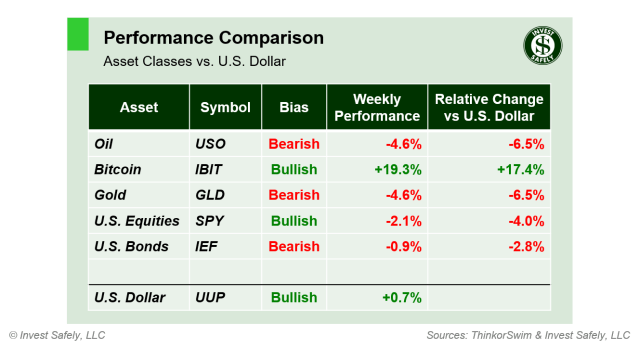
Asset Class Performance for Week 46 2024
A tough week for any asset not called Bitcoin ( $IBIT ) which rallied another 19%(!). Combined with the prior week’s 11% rally puts Bitcoin up 30% in two weeks. Worst performance was a toss-up between gold ( $GLD ) and oil ( $USO ), both of which fell close to 5% and moved to a bearish bias longer term.
COMMENTARY
After starting the week in overbought territory, last week’s reversion wasn’t too surprising. Investors continue to evaluate potential moves from the Trump administration. For example, the expected shifts in regulations and oversight caused flows out of healthcare and into financials and energy.
That doesn’t mean macroeconomic concerns aren’t present. The US dollar’s continued uptrend creates a lot of pressure on the financials of international companies. That strength not only pushes their stock prices lower, but also affects global currencies, and country ETFs (e.g. Europe and Asia). And despite the recent Fed rate cuts, mid and long term interest rates continue to climb, putting pressure on bonds and rate sensitive sectors like Real Estate and Utilities.
September inflation data was a bit higher than expected, but not enough to alter the FOMC’s rate cut path significantly. Their focus in on unemployment for the time being.
| CPI (y/y) | Actual | Prior |
Expected |
| Headline | +2.6% | +2.4% | +2.6% |
| Core | +3.3% | +3.3% | +3.3% |
The consumer price index (CPI) rose in September, for the first time in sixth months. Core CPI was unchanged.
| PPI (y/y) | Actual | Prior |
Expected |
| Headline | +2.4% | +1.9% | +2.3% |
| Core | +3.1% | +2.9%* | +3.0% |
Producer prices (PPI) rose in October, as it did in September. September Core PPI was revised 30 basis points higher (up from 2.6%), but October inflation was higher still.
Nothing exciting expected in macroeconomic news this week, which is fine, because all eyes will be focused on Nvidia’s earnings report (Wednesday).
Best to Your Week!
P.S. If you find this research helpful, please tell a friend.
If you don’t, tell an enemy.


