
Stock Market Outlook entering the Week of November 3rd = Uptrend
- ADX Directional Indicators: Downtrend
- On Balance Volume Indicator: Uptrend
- Institutional Activity (Price & Volume): Mixed
ANALYSIS
The stock market outlook remains in an uptrend, but is on the verge of a trend change after another week of poor performance.
The S&P500 ( $SPX ) fell 1.4%. The index sits ~0.5% above the 50-day moving average and ~7% above the 200-day moving average.

SPX Price & Volume Chart for Nov 03 2024
The ADX ( Average Directional Index ) flipped to bearish on Thursday, as the market continued its recent trend of lower highs and lower lows. An ADX reading greater than 25 (currently 23) would confirm the signal.
OBV ( On-Balance Volume ) remains bullish, sitting just above the 3-month moving average.
Institutional Activity moved to mixed, as increased selling pushed the index down to the 50-day moving average and the distribution day count up to 7.
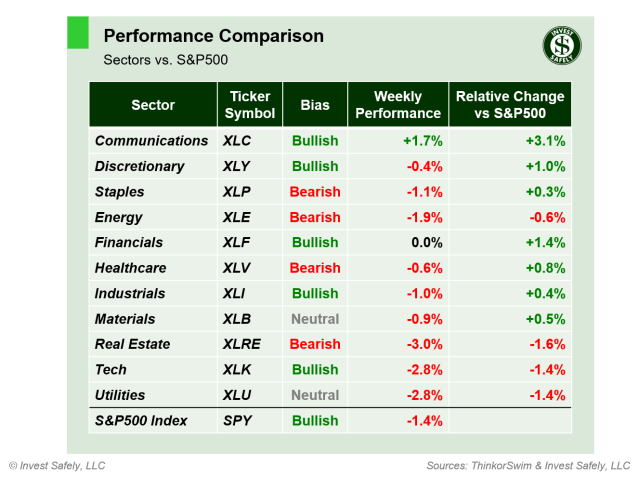
S&P Sector Performance for Week 44 of 2024
Bias took a negative shift last week, with several sectors moving to a bearish ($XLP, $XLE, $XLV, and $XLRE), while Materials and Utilities are now neutral. The Communication Services sector ( $XLC ) outperformed, largely due to Google’s ( $GOOG/$GOOGL ) performance. Rate sensitive sectors, like Real estate ( $XLRE ) and Utilities ( $XLU ), were the weakest sectors, in response to rising Treasury yields.

Sector Style Performance for Week 44 of 2024
Low Beta, Small Cap Value, Quality and High Dividend sector styles moved to a Neutral bias. Small Cap Growth ( $IWO ) was one of two styles able to eek out a gain last week, while High Beta ( $SPHB ) led to the downside.
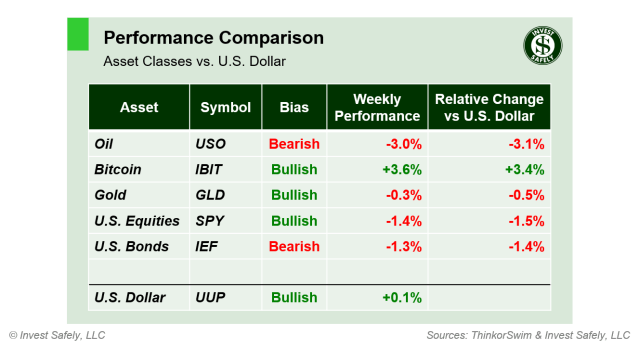
Asset Class Performance for Week 44 2024
As expected, oil ( $USO ) retained the bearish bias that developed last Sunday evening, and went on to end the week as the worst asset class. Bitcoin was the best class ( $IBIT ).
COMMENTARY
ISM Manufacturing PMI continues to show a contraction in the sector, with demand weakening month over month.
September JOLTS was below expectations and fell from a negatively revised August number, indicating a cooling labor market. October NFP figures were far below expectations, but likely impacted by the strikes at Boeing and recent hurricanes. More concerning were the negative revisions to August AND September figures.
The “advance” Q3 GDP estimate showed an increase of 2.8%, slightly lower than Q2, but well below the 4.4% seen last year.
Headline PCE for September showed inflation dropped slightly from a positively revised August figure, while core was flat.
| PCE (y/y) | Actual | Prior |
Expected |
| Headline | +2.1% | +2.3%* | +2.1% |
| Core | +2.7% | +2.7% | +2.6% |
This week we get ISM Services PMI ( Tuesday ), and the FOMC’s verdict on another rate cut ( Thursday ). U.S. elections are on Tuesday, so don’t be surprised by volatility on Tuesday and Wednesday.
You don’t need to wait for those events to protect yourself from volatility. When trades shift to bearish bias, it’s time to lower exposure anyway. Instead, look to put your money to work using investments that are showing signs of strength.
Best to Your Week!
P.S. If you find this research helpful, please tell a friend.
If you don’t, tell an enemy.


