
Stock Market Outlook entering the Week of October 27th = Uptrend
- ADX Directional Indicators: Uptrend
- On Balance Volume Indicator: Uptrend
- Institutional Activity (Price & Volume): Uptrend
ANALYSIS
The stock market outlook remains in an uptrend, after the S&P500 ( $SPX ) fell 1% last week. The index sits ~2% above the 50-day moving average and ~9% above the 200-day moving average.
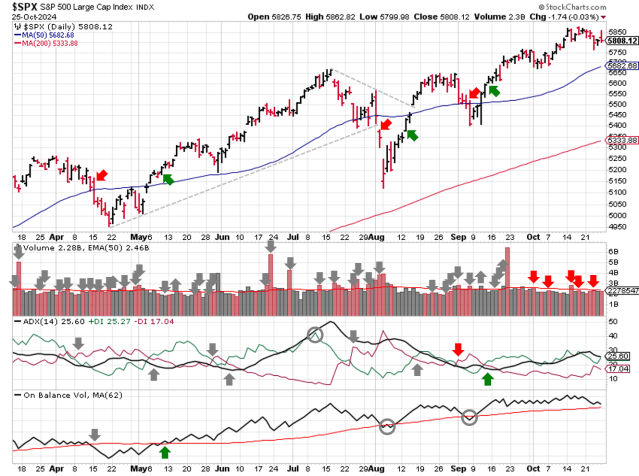
SPX Price & Volume Chart for Oct 27 2024
All three indicators ( Average Directional Index, On-Balance Volume, and Institutional Activity ) remain bullish, although they all weakened during the week too. It’s not too concerning at this point, with most of the S&P segments remaining bullish bias. Keep an eye out this week for further developments.

S&P Sector Performance for Week 43 of 2024
Almost every sector followed the S&P500 lower last week, with stocks in the Materials sector ( $XLB ) leading the way. Consumer Discretionary ( $XLY ) outperformed, in large part due to Tesla’s ( $TSLA ) post-earnings performance. Healthcare ( $XLV ) weakened further, falling from a neutral to bearish bias, while Consumer Staples ( $XLP ) dropped to Neutral.
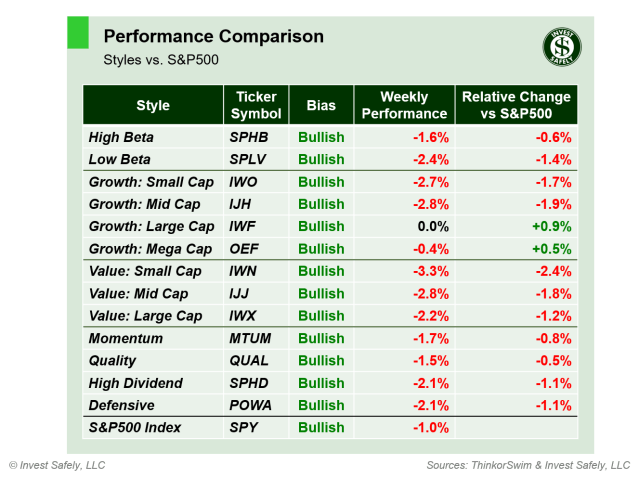
Sector Style Performance for Week 43 of 2024
All sector styles start the week with a bullish bias, but last week’s performance was poor across the board. Large cap growth managed to breakeven ( $IWF ) on the strength of Mag 7 stocks, while small cap value ( $IWN ) led to the downside.
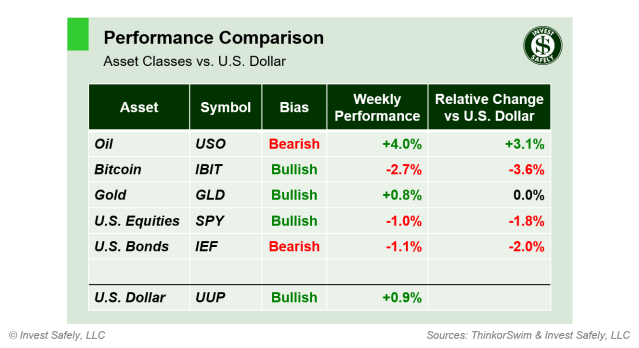
Asset Class Performance for Week 43 2024
As of Friday’s close, oil ( $USO ) was back to a bullish bias and led assets higher. Last week’s rally was front-running Israeli military action against Iran. As of Sunday evening, oil futures are down again and have a bearish bias. Bitcoin was the worst sector ( $IBIT ), but appears to have recovered over the weekend.
COMMENTARY
September Durable Goods orders fell 0.8%, slightly less than expected, but well off last year’s 4% increase.
After a couple quiet week’s, macroeconomic data is back in the spotlight this week: September JOLTS ( Tuesday ), the “advance” ( i.e. first ) Q3 GDP estimate ( Wednesday ), September PCE ( Thursday ), and October NFP & ISM Mfg PMI ( Friday ). And don’t forget earnings season is in full swing, which can move prices around significantly ( e.g.Tesla last week ).
Best to Your Week!
P.S. If you find this research helpful, please tell a friend.
If you don’t, tell an enemy.


