
Stock Market Outlook entering the Week of October 20th = Uptrend
- ADX Directional Indicators: Uptrend
- On Balance Volume Indicator: Uptrend
- Institutional Activity (Price & Volume): Uptrend
ANALYSIS
The stock market outlook remains in an uptrend, after the S&P500 ( $SPX ) rose 0.9% last week. The index sits ~4% above the 50-day moving average and ~11% above the 200-day moving average.
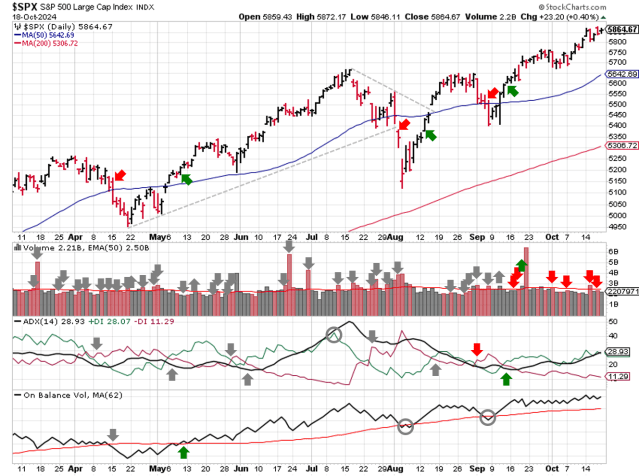
SPX Price & Volume Chart for Oct 20 2024
All three indicators ( Average Directional Index, On-Balance Volume, and Institutional Activity ) remain bullish after last week’s action.

S&P Sector Performance for Week 42 of 2024
Within the S&P500, Healthcare ( $XLV ) drops to a neutral bias, reflecting recent weakness in the sector. Stocks in the Utility sector ( $XLU ) outperformed last week, followed closely by Real Estate ( $XLRE ). Energy ( $XLE ) underperformed, following oil-related assets lower.

Sector Style Performance for Week 42 of 2024
All sector styles retain a bullish bias this week. Value names ( $IWN & $IJJ ) led to the upside last week, while High Beta ( $SPHB ) and Defensive ( $POWA ) names led to the downside.

Asset Class Performance for Week 42 2024
After a strong showing the past few weeks, Oil stumbled and now joins Bonds with a bearish bias. Bitcoin continues it’s recent rally, while Gold continues it’s slow and steady climb since early August.
COMMENTARY
Another light week for macro data. September retail sales came in at 0.4%; slightly above expectations but down 50% year over year.
Another heavy week of earnings reports on tap. Forward guidance is key, so keep an eye on those conference call transcripts.
Best to Your Week!
P.S. If you find this research helpful, please tell a friend.
If you don’t, tell an enemy.


