
Stock Market Outlook entering the Week of October 13th = Uptrend
- ADX Directional Indicators: Uptrend
- On Balance Volume Indicator: Uptrend
- Institutional Activity (Price & Volume): Uptrend
ANALYSIS
The stock market outlook maintains an uptrend after digesting the latest inflation data.
The S&P500 ($SPX) rose 1.1% last week. The index sits ~4% above the 50-day moving average and ~10% above the 200-day moving average.
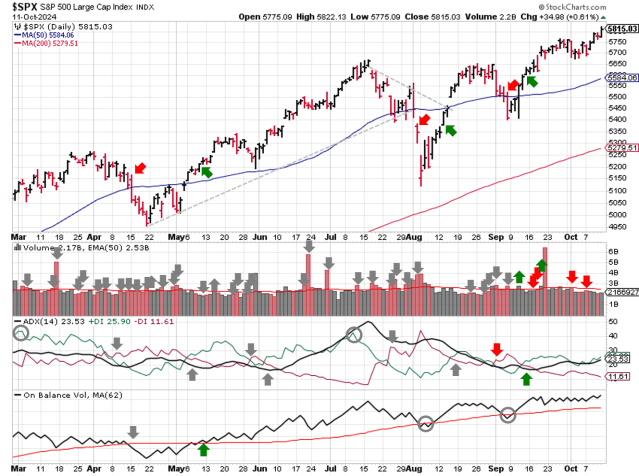
SPX Price & Volume Chart for Oct 13 2024
All three indicators ( Average Directional Index, On-Balance Volume, and Institutional Activity ) remain bullish after last week’s action.

S&P Sector Performance for Week 41 of 2024
Within the S&P500, all sectors start the week with a bullish bias. Stocks in the Technology sector ( $XLK ) outperformed last week, along with Industrials ( $XLI ). Utilities ( $XLU ) underperformed, as did other rate sensitive investments.
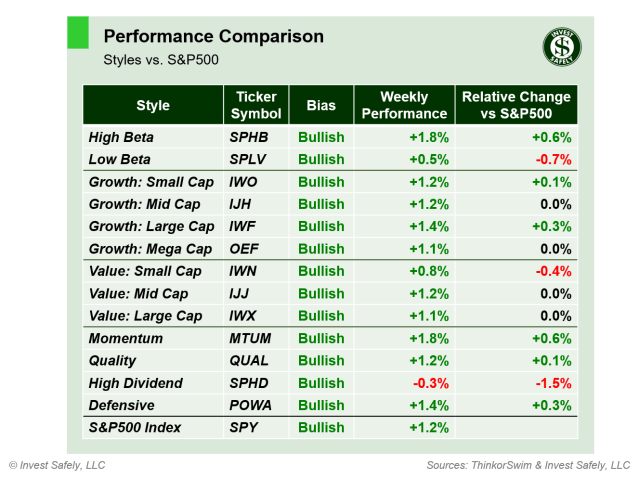
Sector Style Performance for Week 41 of 2024
Style-wise, everything starts the week with a bullish bias as well. Momentum ( $MTUM ) and High Beta ( $SPHB ) led to the upside last week, while high Dividend ( $SPHD ) led to the downside.
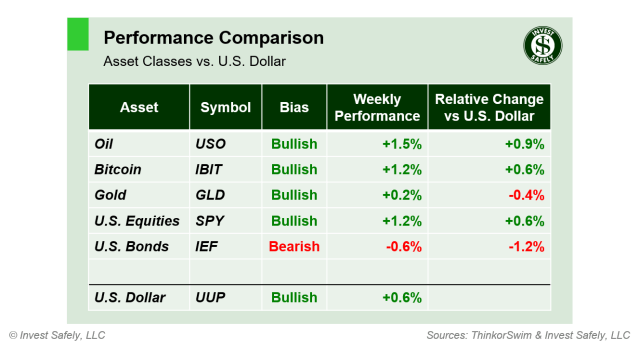
Asset Class Performance for Week 41 2024
A majority of asset classes start the week with a bullish bias too. However, U.S treasury rates continuing to climb, despite the recent FOMC rate cut. As a result, bonds underperformed, along with bond proxies, such as Utilities and High dividend stocks. Oil ( $USO ) outperformed for the second week in a row.
COMMENTARY
During strong market rallies, when most assets are bullish, it’s important to harvest profits from overbought investments and redistribute those gains into sectors, styles, and asset classes that are oversold. For instance, reducing position sizes in Industrial names, and adding to positions in Utilities or Gold.
The consumer price index (CPI) fell for the sixth month in a row, down to 2.4% y/y in September. Core CPI was slightly higher.
| CPI (y/y) | Actual | Prior |
Expected |
| Headline | +2.4% | +2.5% | +2.3% |
| Core | +3.3% | +3.2% | +3.2% |
Producer prices (PPI) rose in September, exceeding expectations. Revisions to the August data set softened the blow somewhat (*August Core PPI was revised higher from 2.2% to 2.6%, while August’s Headline figure increased by 0.2%).
| PPI (y/y) | Actual | Prior |
Expected |
| Headline | +1.8% | +1.9%* | +1.6% |
| Core | +2.8% | +2.6%* | +2.7% |
Earnings releases pick up on Tuesday, and we get retail sales data on Thursday.
Best to Your Week!
P.S. If you find this research helpful, please tell a friend.
If you don’t, tell an enemy.


